In the world of scientific experiments there is no such thing as an exact measurement. Instead, the standard scientific approach is to deal in degrees of confidence. Things we have greater confidence in are things that we can state to a higher degree of precision, but no matter how well we measure something it will never get to the point where it can be stated as an absolute number. Scientists represent this level of precision with what is known as “confidence intervals”, a standard that has been adopted in all industries and domains across the globe. One of the best-known examples of confidence intervals in everyday life are the margins of error that are typically disclosed in opinion polls.
So what are confidence intervals? They represent the range in which the true value is very likely to be, taking into account the entire pool of data measurements. Confidence intervals aren't set in stone at a specific range, they're determined for each set of data by a number of factors: most prominently, the number of measurements and the variability of those measurements. So the more data measurements for a particular metric, the closer the confidence intervals will be to the average value. Likewise, if measurements do not vary much, the confidence intervals will be small. So, the smaller the confidence intervals, the better. If confidence intervals for two comparable values overlap, this means there is no meaningful difference between these two values — this result is represented as 'joint winner' in our reports.
Anyone who ignores any level of uncertainty of measurements — such as confidence intervals — is potentially drawing spurious and misleading conclusions. At Opensignal, we strongly believe in treating operators fairly so where any results are statistically not significantly different we declare a 'joint winner' rather than incorrectly declaring a single winner. We calculate our confidence intervals using a standard statistical approach, and include them as part of our commitment to report robust and transparent information based on our data.
In Opensignal's analyses, we show confidence intervals as small brackets on our charts, that are displayed as an elongated ‘H’ at the end of each chart item. An example can be seen in our Mobile Network Experience report on Japan (Apr 2022), where NTT DoCoMo and Rakuten tied for our 5G Download speed award:
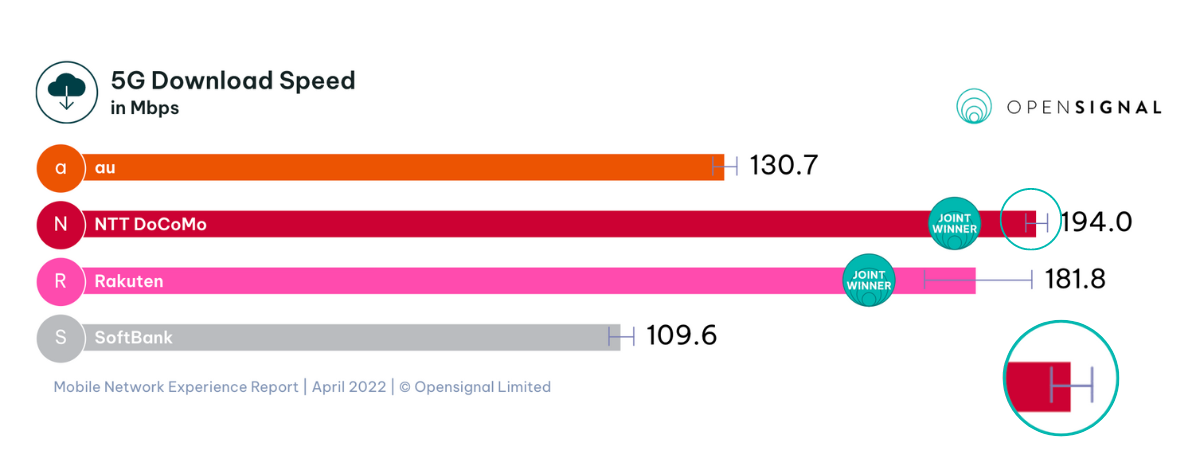
Whenever the confidence intervals for two or more operators overlap in a particular metric, the result is a statistical tie. This is because one operator's apparent lead may not hold true once measurement uncertainty is taken into account. In technical terms, the difference is not considered to be “statistically significant” — even when it may appear one operator is ahead of another. We believe this transparency of data is vital to our mission to be the most objective and trusted global standard for network experience.
Find out more about our metrics in this post, or watch a short video explaining confidence intervals.
Opensignal Limited retains ownership of this insight including all intellectual property rights, data, content, graphs & analysis. Reports and insights produced by Opensignal Limited may not be quoted, reproduced, distributed, published for any commercial purpose (including use in advertisements or other promotional content) without prior written consent. Journalists are encouraged to quote information included in Opensignal reports and insights provided they include clear source attribution. For more information, contact [email protected].