Following last year’s analysis of the mobile network experience of our smartphone users at major U.S. airports, Opensignal publishes a more granular study of carriers’ results at specific U.S. airports. We also investigated the impact of carriers reducing the power-level mitigations on the C-band — that were in place to protect altimeters against interference — combined with the roll-out of additional C-band spectrum. Our users on AT&T and Verizon’s networks have enjoyed substantial boosts in their download speeds around U.S. airports after July 1, 2023, when the carriers were to increase power levels on the C-band around the airport areas — but still lag behind T-Mobile's 5G users' speeds.

The aviation industry raised concerns that the deployment of 5G services in the C-band would interfere with altimeter equipment. This led to AT&T and Verizon delaying and/or voluntarily mitigating their 5G roll-outs around the airports until July 2023 — although still with some measures in place (e.g. some power level restrictions) around 188 airports in place until January 1, 2028. The delay until the beginning of July 2023 allowed the necessary legislative changes and gave time for the aviation industry to upgrade their equipment, as mandated by the Federal Aviation Administration (FAA). According to the FAA, the risk of 5G interferences has been mitigated as the entire U.S. airline fleet completed retrofitting its less-interference-resilient radio altimeters by the end of September 2023.
As AT&T and Verizon were able to increase power levels on C-band 5G services around the airports on July 1, 2023, using the frequencies purchased during the C-band auction — Opensignal investigated the impact of the new spectrum used on the mobile network experience of our users around 20 selected U.S. airports. We compared two 90-day data collection periods — the first of which starts on April 1, 2023 which ended just before AT&T and Verizon could increase power levels on the C-band. The other timeframe starts on August 1, 2023 and covers 90 days after the easing of the mitigation measures around the airports.
Our users on AT&T and Verizon enjoy stunning boosts in their average 5G download speeds after August 1, 2023 — compared to the period before July 1, 2023 — of 79.6% and 62.1%, respectively. Both surpass the 100Mbps milestone around the airport areas and are in a statistical tie, with scores of 126.9-132.2Mbps.
Meanwhile, T-Mobile has not seen any statistically significant changes in its 5G Download Speed score around the 20 analyzed U.S. airports. While the carrier still commands a substantial margin over its competitors for 5G Download Speed — both AT&T and Verizon have whittled away at T-Mobile’s lead. Before the frequency switchover, T-Mobile’s average 5G download speeds were 2.4 times faster than AT&T’s and 2.1 times faster than Verizon’s. After AT&T and Verizon were able to increase spectrum bandwidth and power levels for 5G services in the C-band around the airports, T-Mobile’s lead over its rivals has shrunk to 32-37.5%.
While both carriers were able to reduce the mitigations around the use of the C-band around the airport areas in July 2023 — AT&T and Verizon also gained full access to their C-band spectrum holdings in August 2023, after satellite companies cleared the band early. Opensignal observed a general uplift in 5G Download Speed scores nationwide, with AT&T’s 5G Download Speed score increasing by 45.1% and Verizon’s — by 29.8% for the 90-day data collection period starting on August 1, 2023, compared to Q2 2023. Still, the relative boost around the selected airports is significantly higher for both AT&T and Verizon than the national uplift, showing the combined effect of the additional spectrum and fewer restrictions on power levels on the mobile network experience of our users.
Soaring AT&T and Verizon’s 5G Download Speed scores positively influence the carriers’ overall Download Speed Experience results. AT&T’s average overall download speeds have risen by 30.4% around the analyzed airports (compared to 12.6% nationally), while Verizon’s — by 22.1% (compared to 7.1% nationally). Consequently, the gap between these two carriers and T-Mobile has narrowed around the airports as well — from 2.3-2.4 times faster average overall download speeds for T-Mobile than AT&T and Verizon to less than twice as fast, after additional C-band spectrum became available and interference mitigation measures relaxed.

In the previous insight on the mobile network experience around U.S. airports, we looked at several metrics around the busiest U.S. airports and how they compared to the U.S. national average. This time, we’re analyzing a few others — Time on Wi-Fi, Availability, and Consistent Quality.
Our smartphone users spend on average 18.3% of their time on Wi-Fi at the U.S. airports — which is nearly two-thirds of the time less compared to the national average of 50%. The U.S. national average includes the time our smartphone users spend at work or home, where they are likely to be connected to Wi-Fi services automatically. Meanwhile, smartphone users move a lot around at the airports, especially while changing over. Many users may not even bother to connect to Wi-Fi, especially if they have unlimited mobile data enabled. Some airport Wi-Fi networks have either limited reach (e.g. at cafes or shops) or offer only restricted features (e.g. limited throughput or time), requiring customers to pay for premium unlimited services. The time spent on Wi-Fi varies greatly between the analyzed U.S. airports — ranging from 14.2% at the JFK airport to 26.2% at Denver International.
Our users connect to 3G or better mobile services 93.8% of the time — which is a much lower result than the U.S. national average of 98.8%. Getting a proper signal around the airport is always a challenge, especially around secluded or distant spots, thick in-building walls that affect the quality of the signal, or network congestion coming from high traffic of users connecting to mobile services at the same time. Aggregated Availability scores range from 90.9% for Denver International — which also sees the highest time on Wi-Fi across all 20 analyzed airports — to 96.9% for Reagan National and 97% for San Diego International.
Our users around the U.S. airports see slightly less consistent quality of mobile services than the national average — 72% compared to 76.8%, respectively. Consistent Quality measures if the network is sufficient to support common mobile application requirements at a level that is ‘good enough’ for users to maintain (or complete) various typical demanding tasks on their devices. To calculate the metric value, the proportion of tests that pass the requirements of Consistent Quality is multiplied by the test success ratio, which is the proportion of completed tests to all tests conducted. Tests that pass indicate that activities such as video calling, uploading an image to social media, or using smart home applications will be possible without noticeable lag or slowdown.
Airport mobile network experience
Opensignal has looked at the mobile network experience of our smartphone users across 20 selected U.S. airports — all of them place in the top 30 of the country’s busiest airports in 2022, according to FAA enplanement statistics. T-Mobile has the highest scores for 5G Availability across all 20 analyzed airports, while it also leads outright for Download Speed Experience and Consistent Quality most frequently out of the three national carriers. Meanwhile, Verizon does so for Games Experience.

T-Mobile scores the highest for Download Speed Experience at Baltimore-Washington International Thurgood Marshall Airport, clocking it at 86.9Mbps — more than 90% faster than its statistically-tied competitors. The carrier commands an impressive lead over Verizon and AT&T for 5G Availability, as our 5G users on T-Mobile’s network spend 3.7 times more of the time connected to 5G service than their Verizon peers — and 5.7 times more than those on AT&T network.
Verizon has the highest score for Games Experience, with 73.4 points on a 100-point scale. Our users around Baltimore-Washington International see no statistically significant difference between the three national carriers for Video Experience. Their experience while using on-demand video streaming services rates as Fair (48-58). This means they are, on average, able to stream video at 720p or better with satisfactory loading times and substantial stalling.
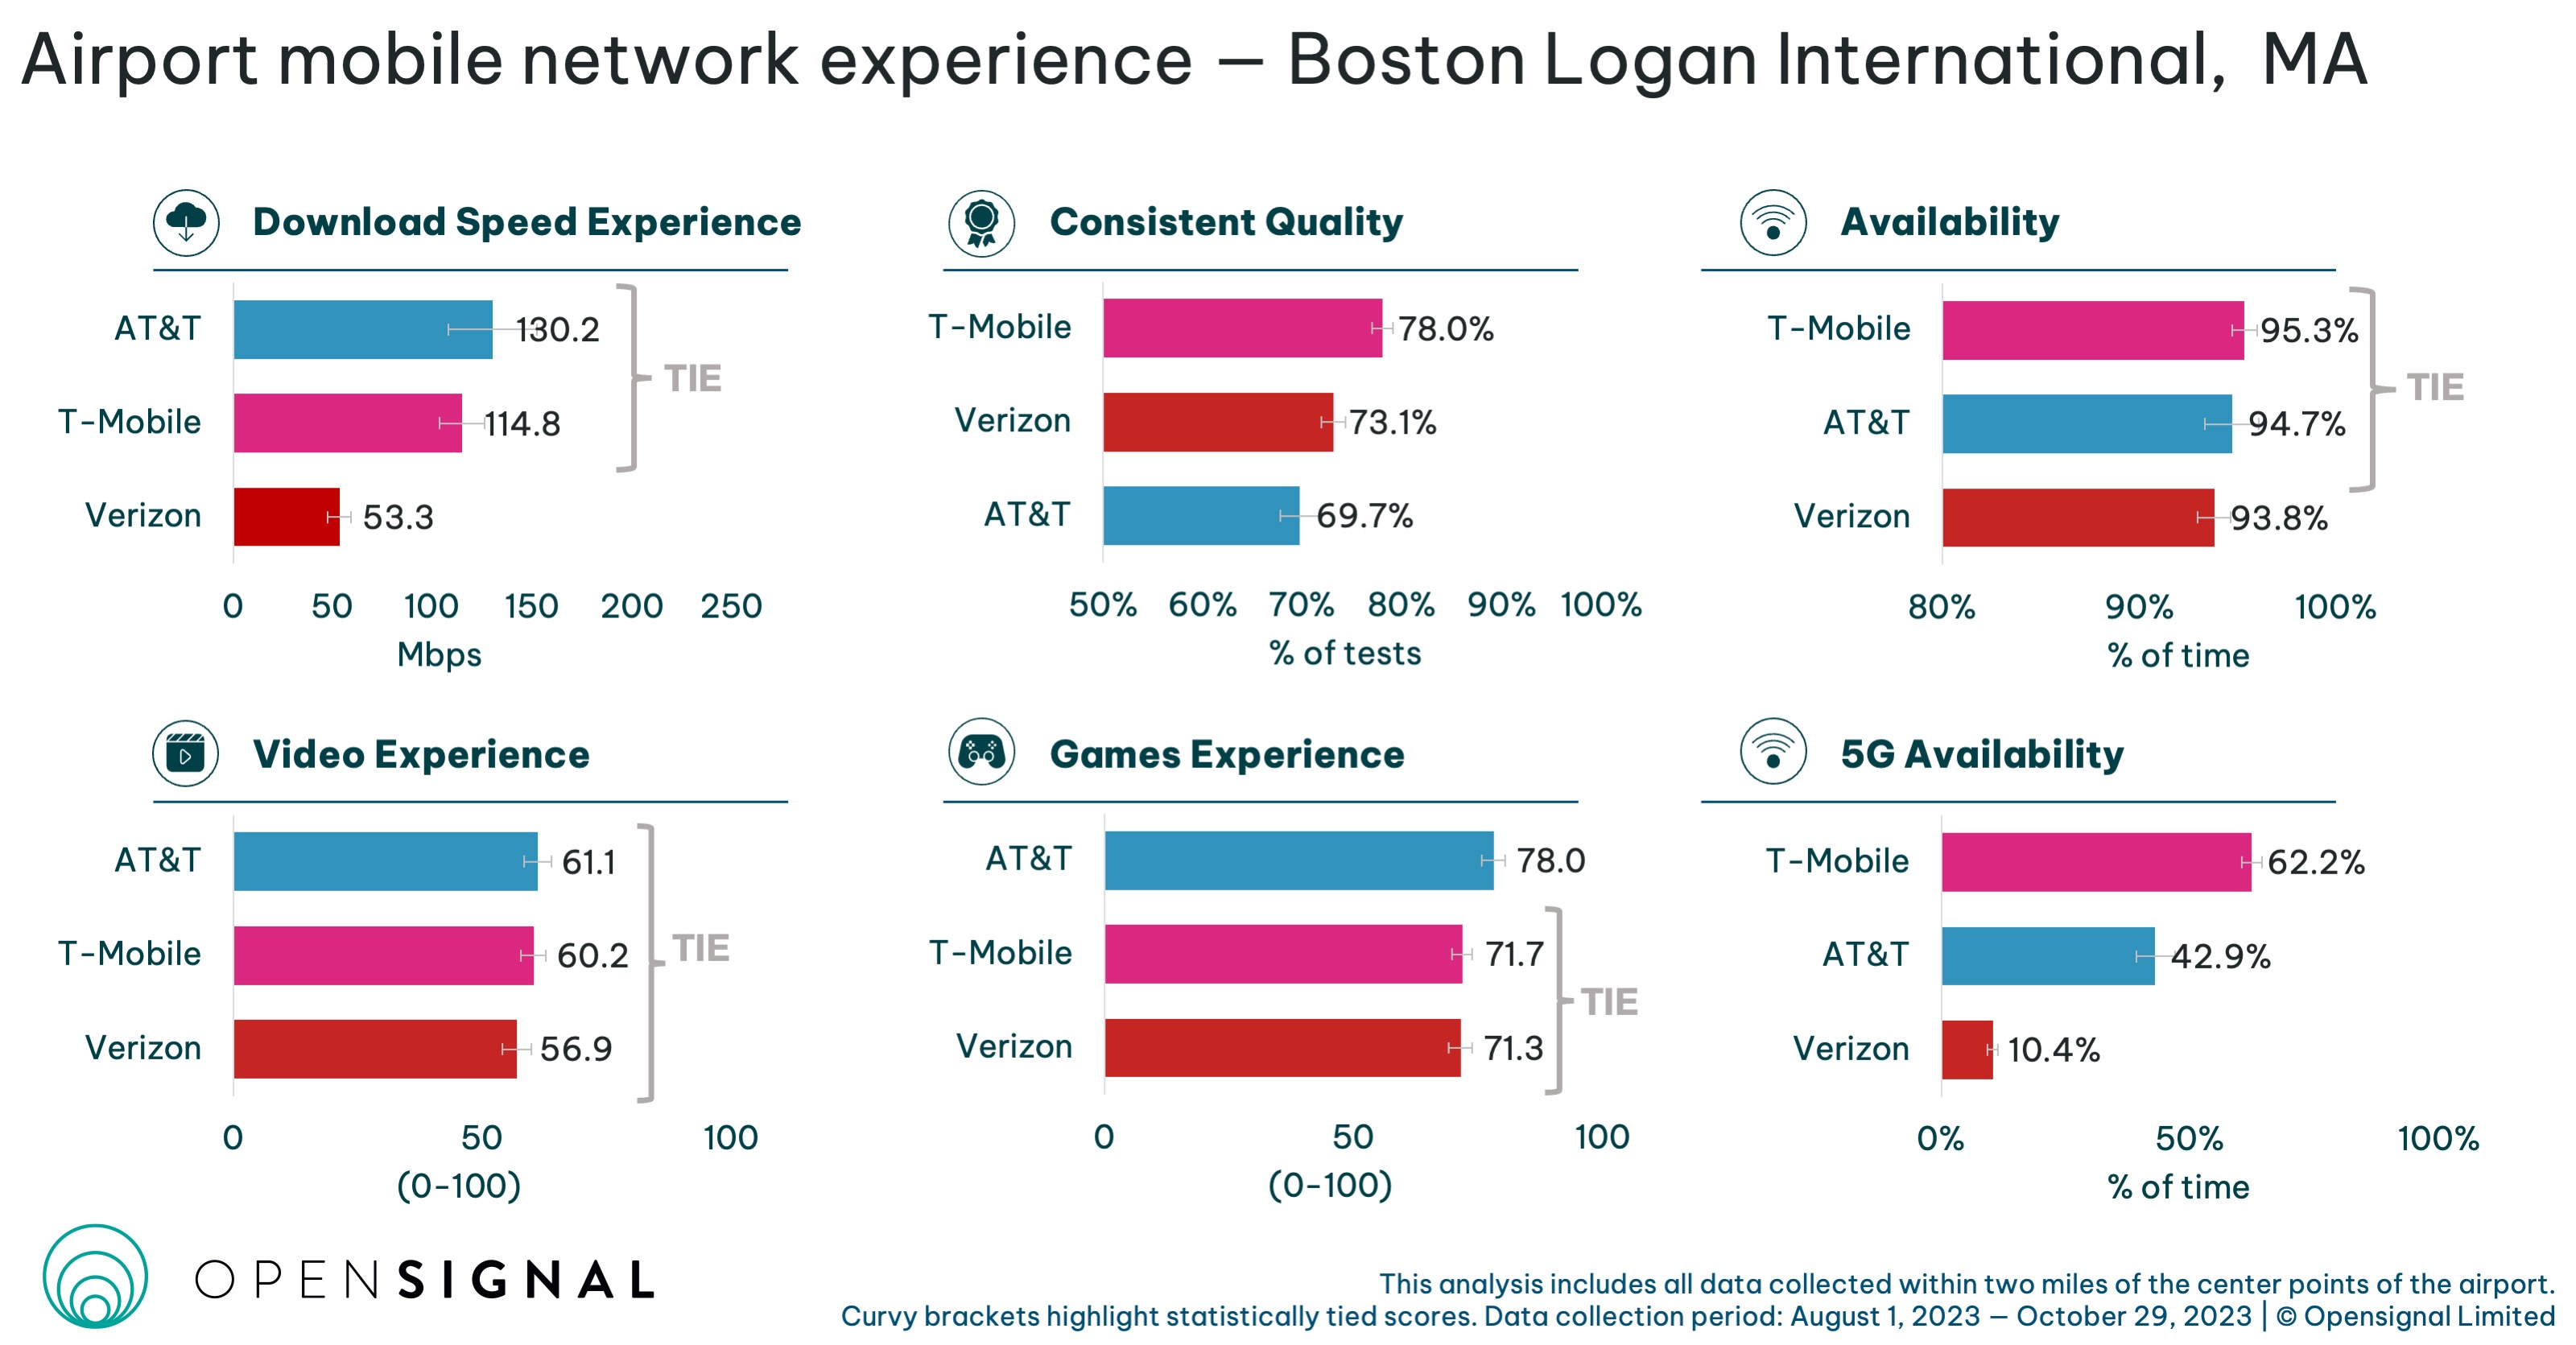
AT&T and T-Mobile jointly have the highest scores for Download Speed Experience at Boston Logan, in the 114.8-130.2Mbps range. Our T-Mobile users enjoy the most consistent quality of mobile services around this airport’s area, 78% — beating Verizon by 4.9 percentage points and AT&T by 8.3 percentage points. T-Mobile triumphs for 5G Availability as well with a score of 62.2% — but AT&T also sees a decent score for this metric, 42.9%, while Verizon lags behind, with 10.4%.
AT&T comes first for Games Experience with a score of 78 points on a 100-point scale — the only carrier to place in the Good (75-85) category at Boston Logan — this means most AT&T users deem the experience acceptable and do not see a delay between their actions and the game.

T-Mobile claims the top spot for Download Speed Experience around the Charlotte-Douglas International Airport, with a score of 78.8Mbps — beating second-placed AT&T by 21.4Mbps and third-placed Verizon by 34Mbps. Our users enjoy the best overall gaming experience on Verizon’s network, which is the only carrier to rate as Fair (65-75) for Games Experience at this airport. T-Mobile triumphs for 5G Availability with a score of 63.3% — 1.8 times higher than AT&T and 3.2 times higher than Verizon.

Chicago O’Hare is the only airport in the observed group where AT&T comes first for Download Speed Experience without statistically tying with another carrier. It does so with a stunning score of 193.6Mbps — which is around 3.6 times faster than what our users on statistically-tied T-Mobile and Verizon observe. AT&T reigns supreme at Chicago O’Hare for Download Speed Experience aided by its mmWave 5G deployments at this airport.
AT&T also comes first for Consistent Quality, with a score of 74.9%, and for Games Experience, with a score of 71 points on a 100-point scale. T-Mobile ends with the highest score for 5G Availability, — 63.1% — ahead of AT&T’s 37.5%.
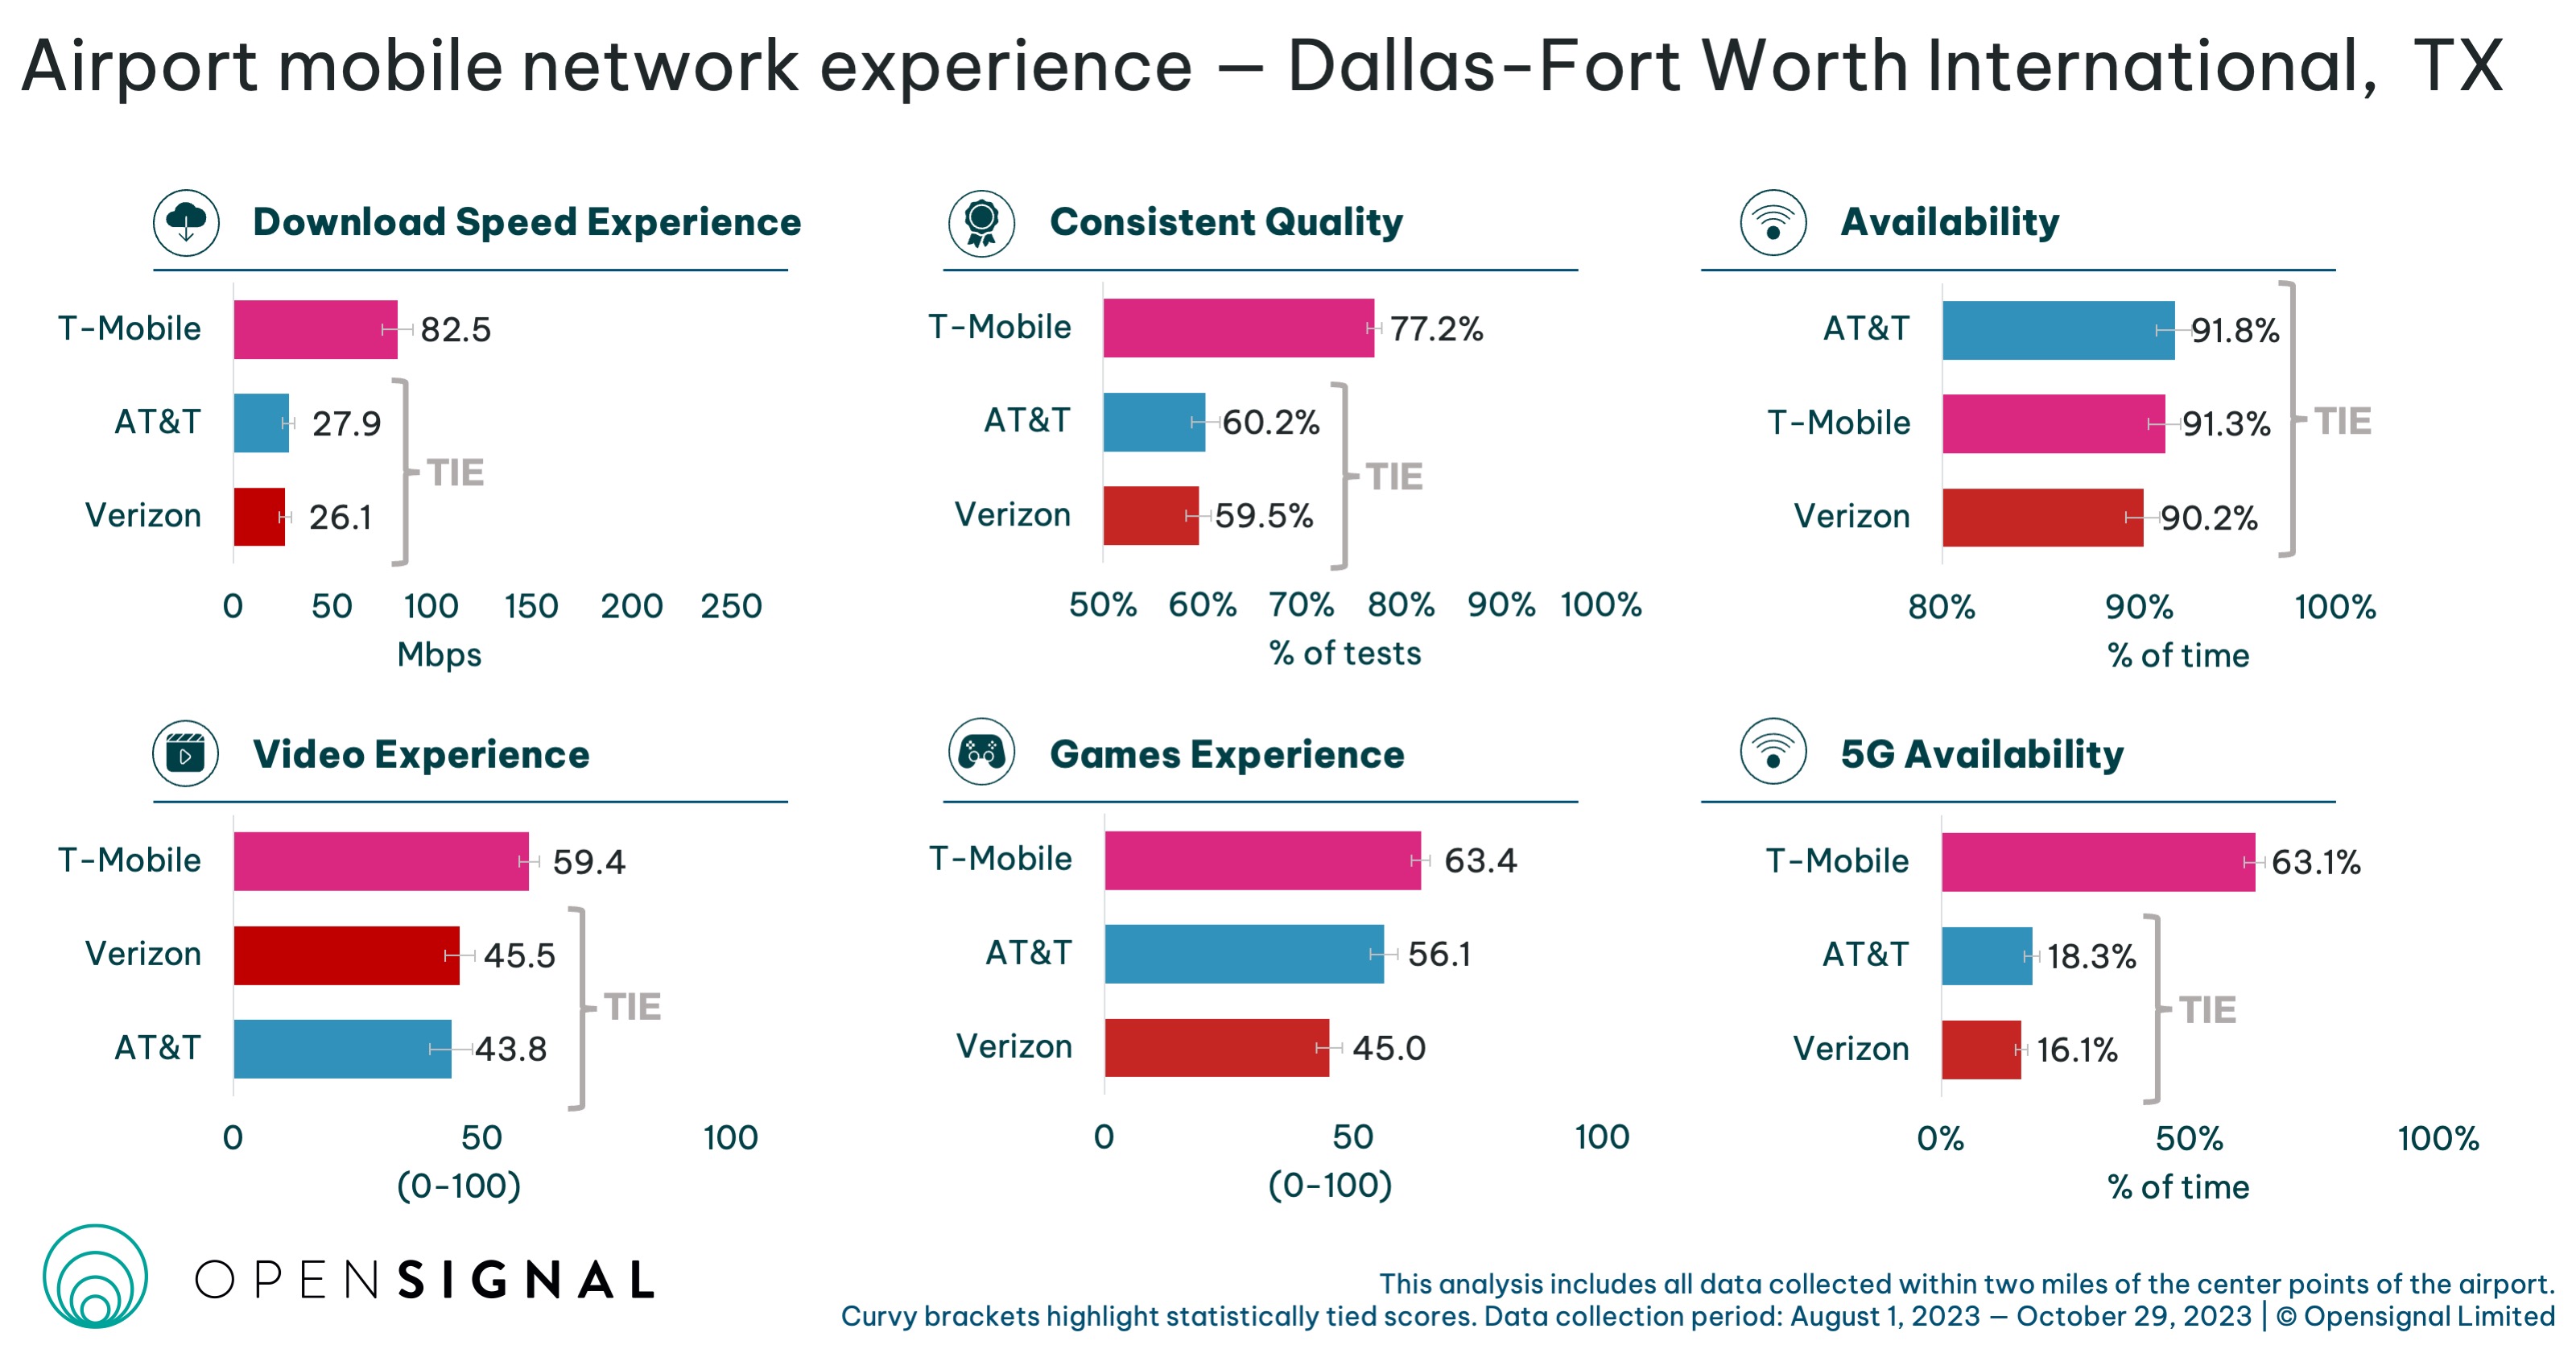
T-Mobile has the outright highest scores for five categories at Dallas-Fort Worth International, the second busiest airport in the U.S. It triumphs for Download Speed Experience with a score of 82.5Mbps, around three times faster than statistically tied AT&T and Verizon. The carrier also commands impressive leads over its statistically tied competitors for Consistent Quality — around 17.3 percentage points — and for 5G Availability, of around 45.8 percentage points.
T-Mobile comes first for Games Experience with a score of 63.4 points and for Video Experience with a score of 59.4 points on a 100-point scale, also commanding sizable margins over AT&T and Verizon. It is the only carrier at Dallas-Fort Worth International to place in the Good (58-68) category — our T-Mobile users are, on average, able to stream video at 720p or better with satisfactory loading times and little stalling.

Verizon comes first for Download Speed Experience at Denver International — the third busiest airport in the U.S. — with a score of 89.5Mbps, 36.5%, faster than T-Mobile and 2.3 times faster than AT&T. This is the only airport in the observed group where Verizon has the highest outright score for Download Speed Experience. Verizon also ties for the top spot with T-Mobile for Consistent Quality, with scores of 67.8-69.3%.
However, T-Mobile dominates 5G Availability with a score of 61.7% — commanding a stunning lead of over 50 percentage points over its statistically tied competitors. This means our T-Mobile 5G users spend around 6.1 times more of their time connected to 5G services than their competitors.
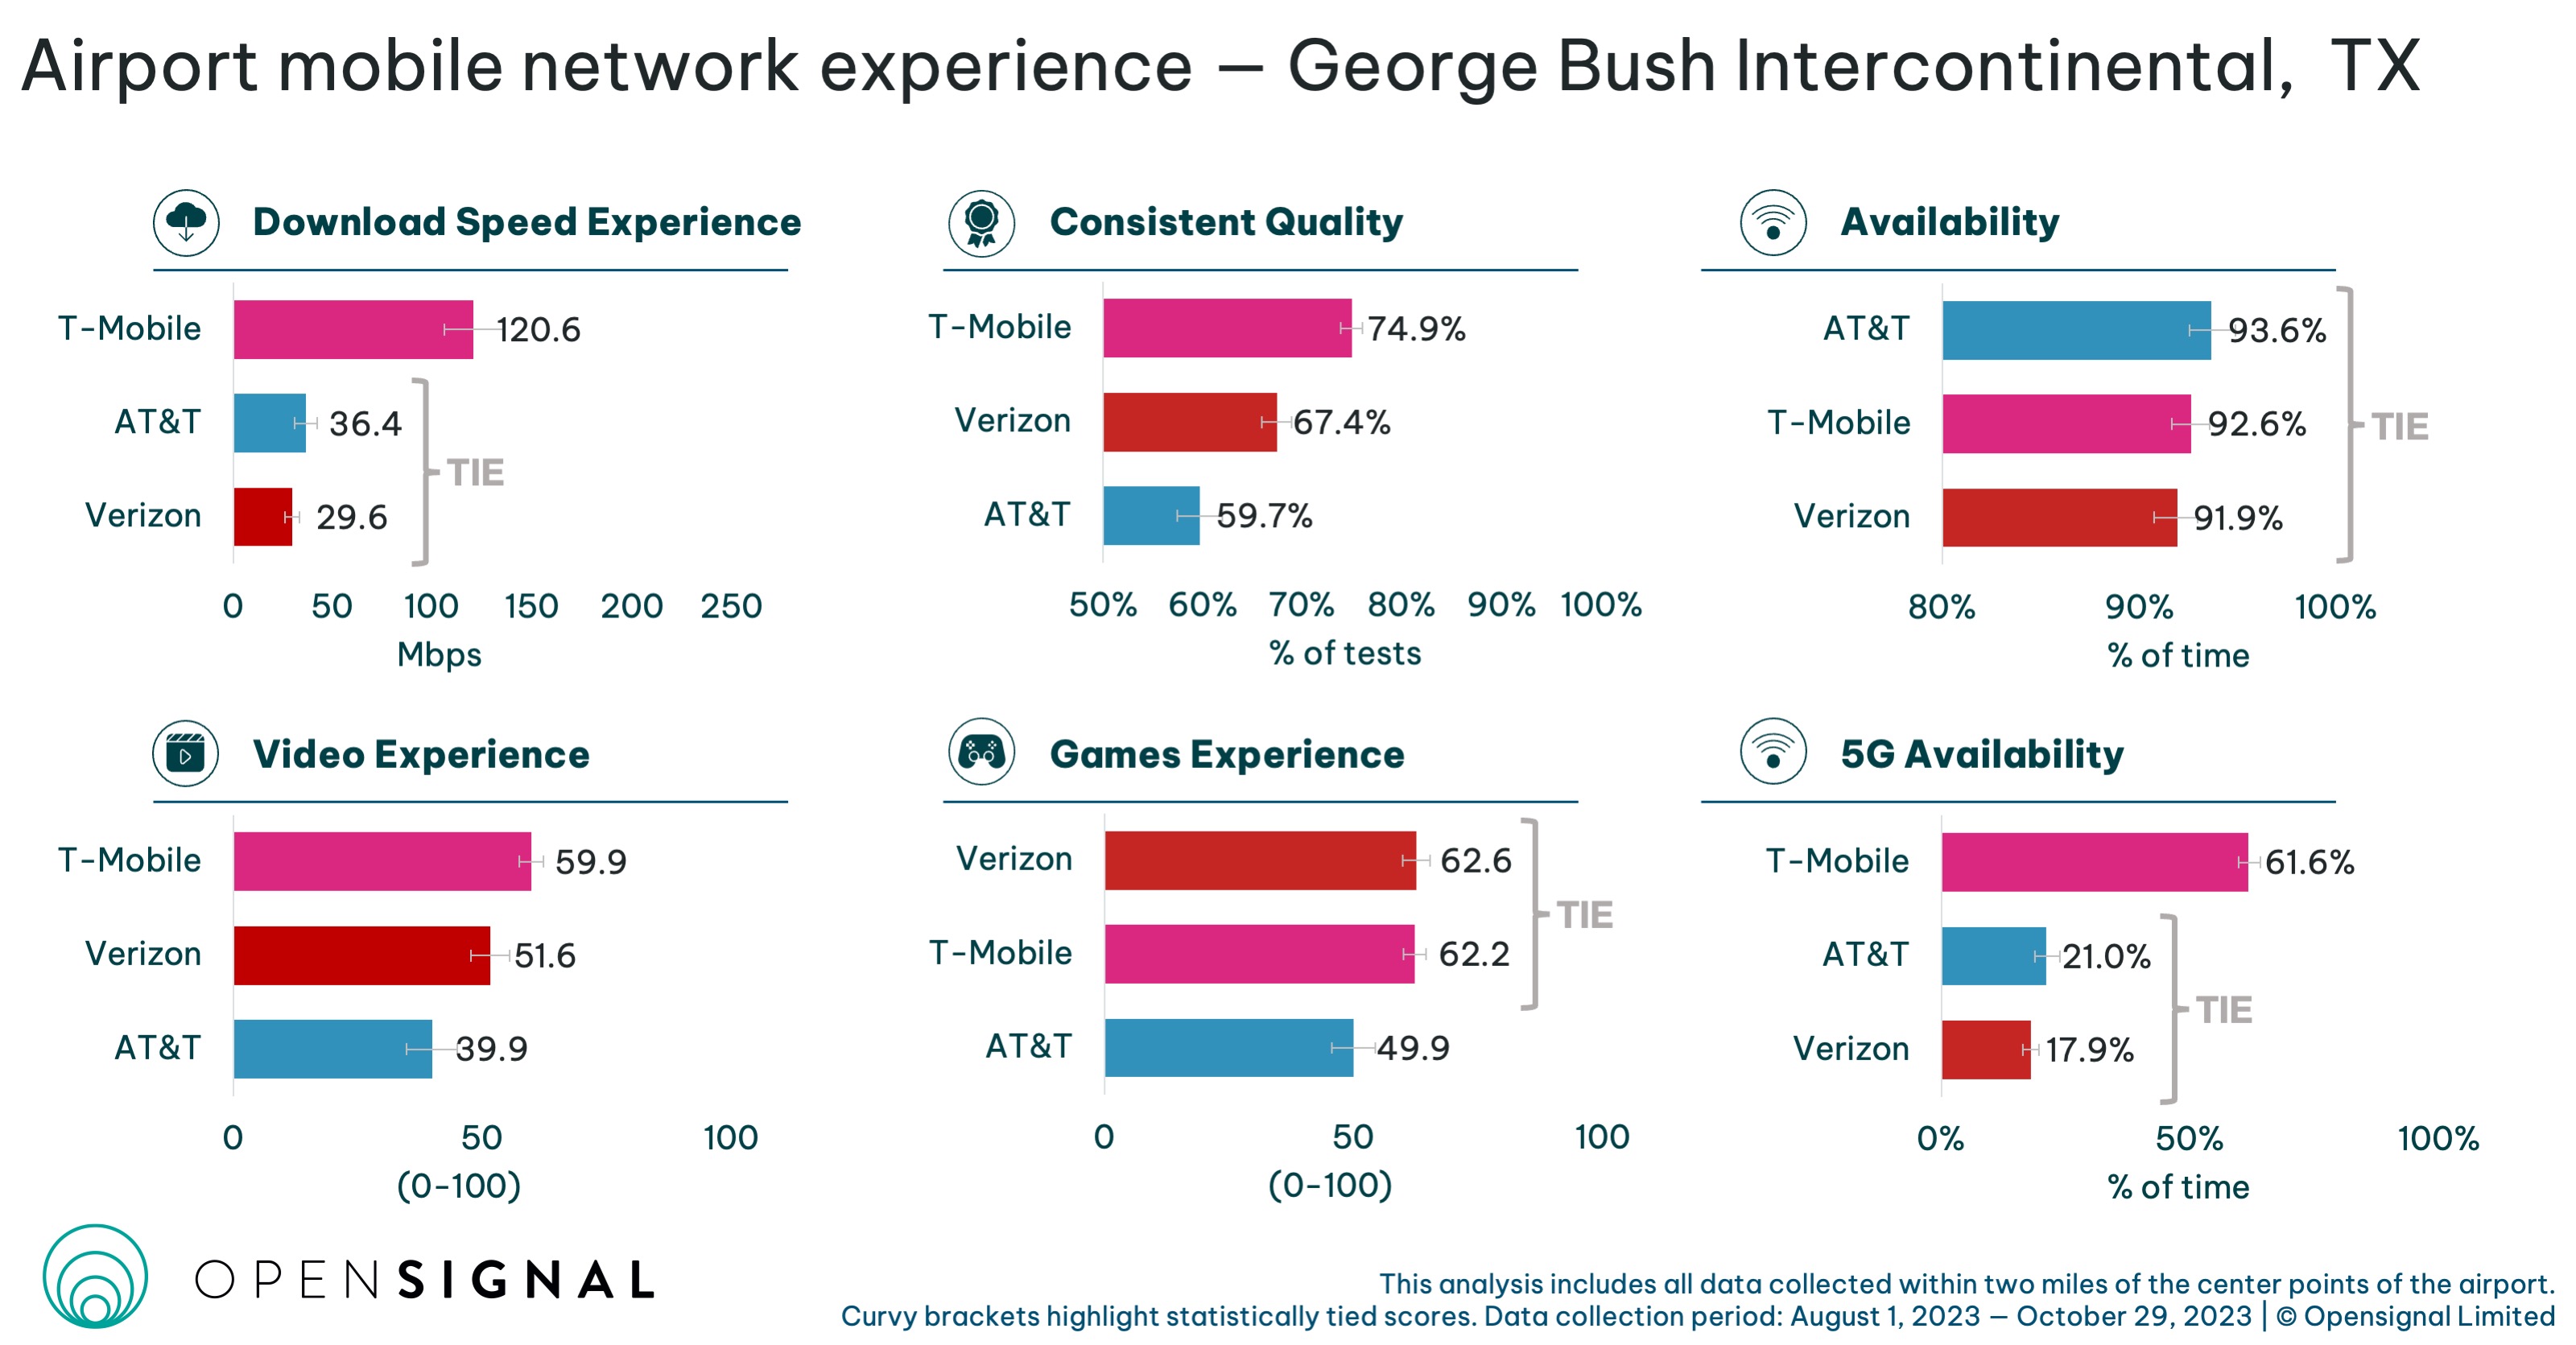
T-Mobile has the outright highest scores across four out of six metrics at the George Bush Intercontinental Airport in Houston, while commanding substantial leads over its competitors. It smashes Download Speed Experience with a score of 120.6Mbps — around 3.7 times faster than statistically tied AT&T and Verizon. Our T-Mobile users also enjoy the most consistent quality of mobile network experience with a score of 74.9% — 7.5 percentage points ahead of Verizon and 15.2 percentage points ahead of AT&T.
T-Mobile leads for Video Experience with a score of 59.9 points on a 100-point scale — the only carrier at George Bush Intercontinental Airport to rate as Good (58-68). Our users are, on average, able to stream video at 720p or better with satisfactory loading times and little stalling. T-Mobile also triumphs for 5G Availability with a score of 61.6% — around 3.2 times more than statistically tied AT&T and Verizon.
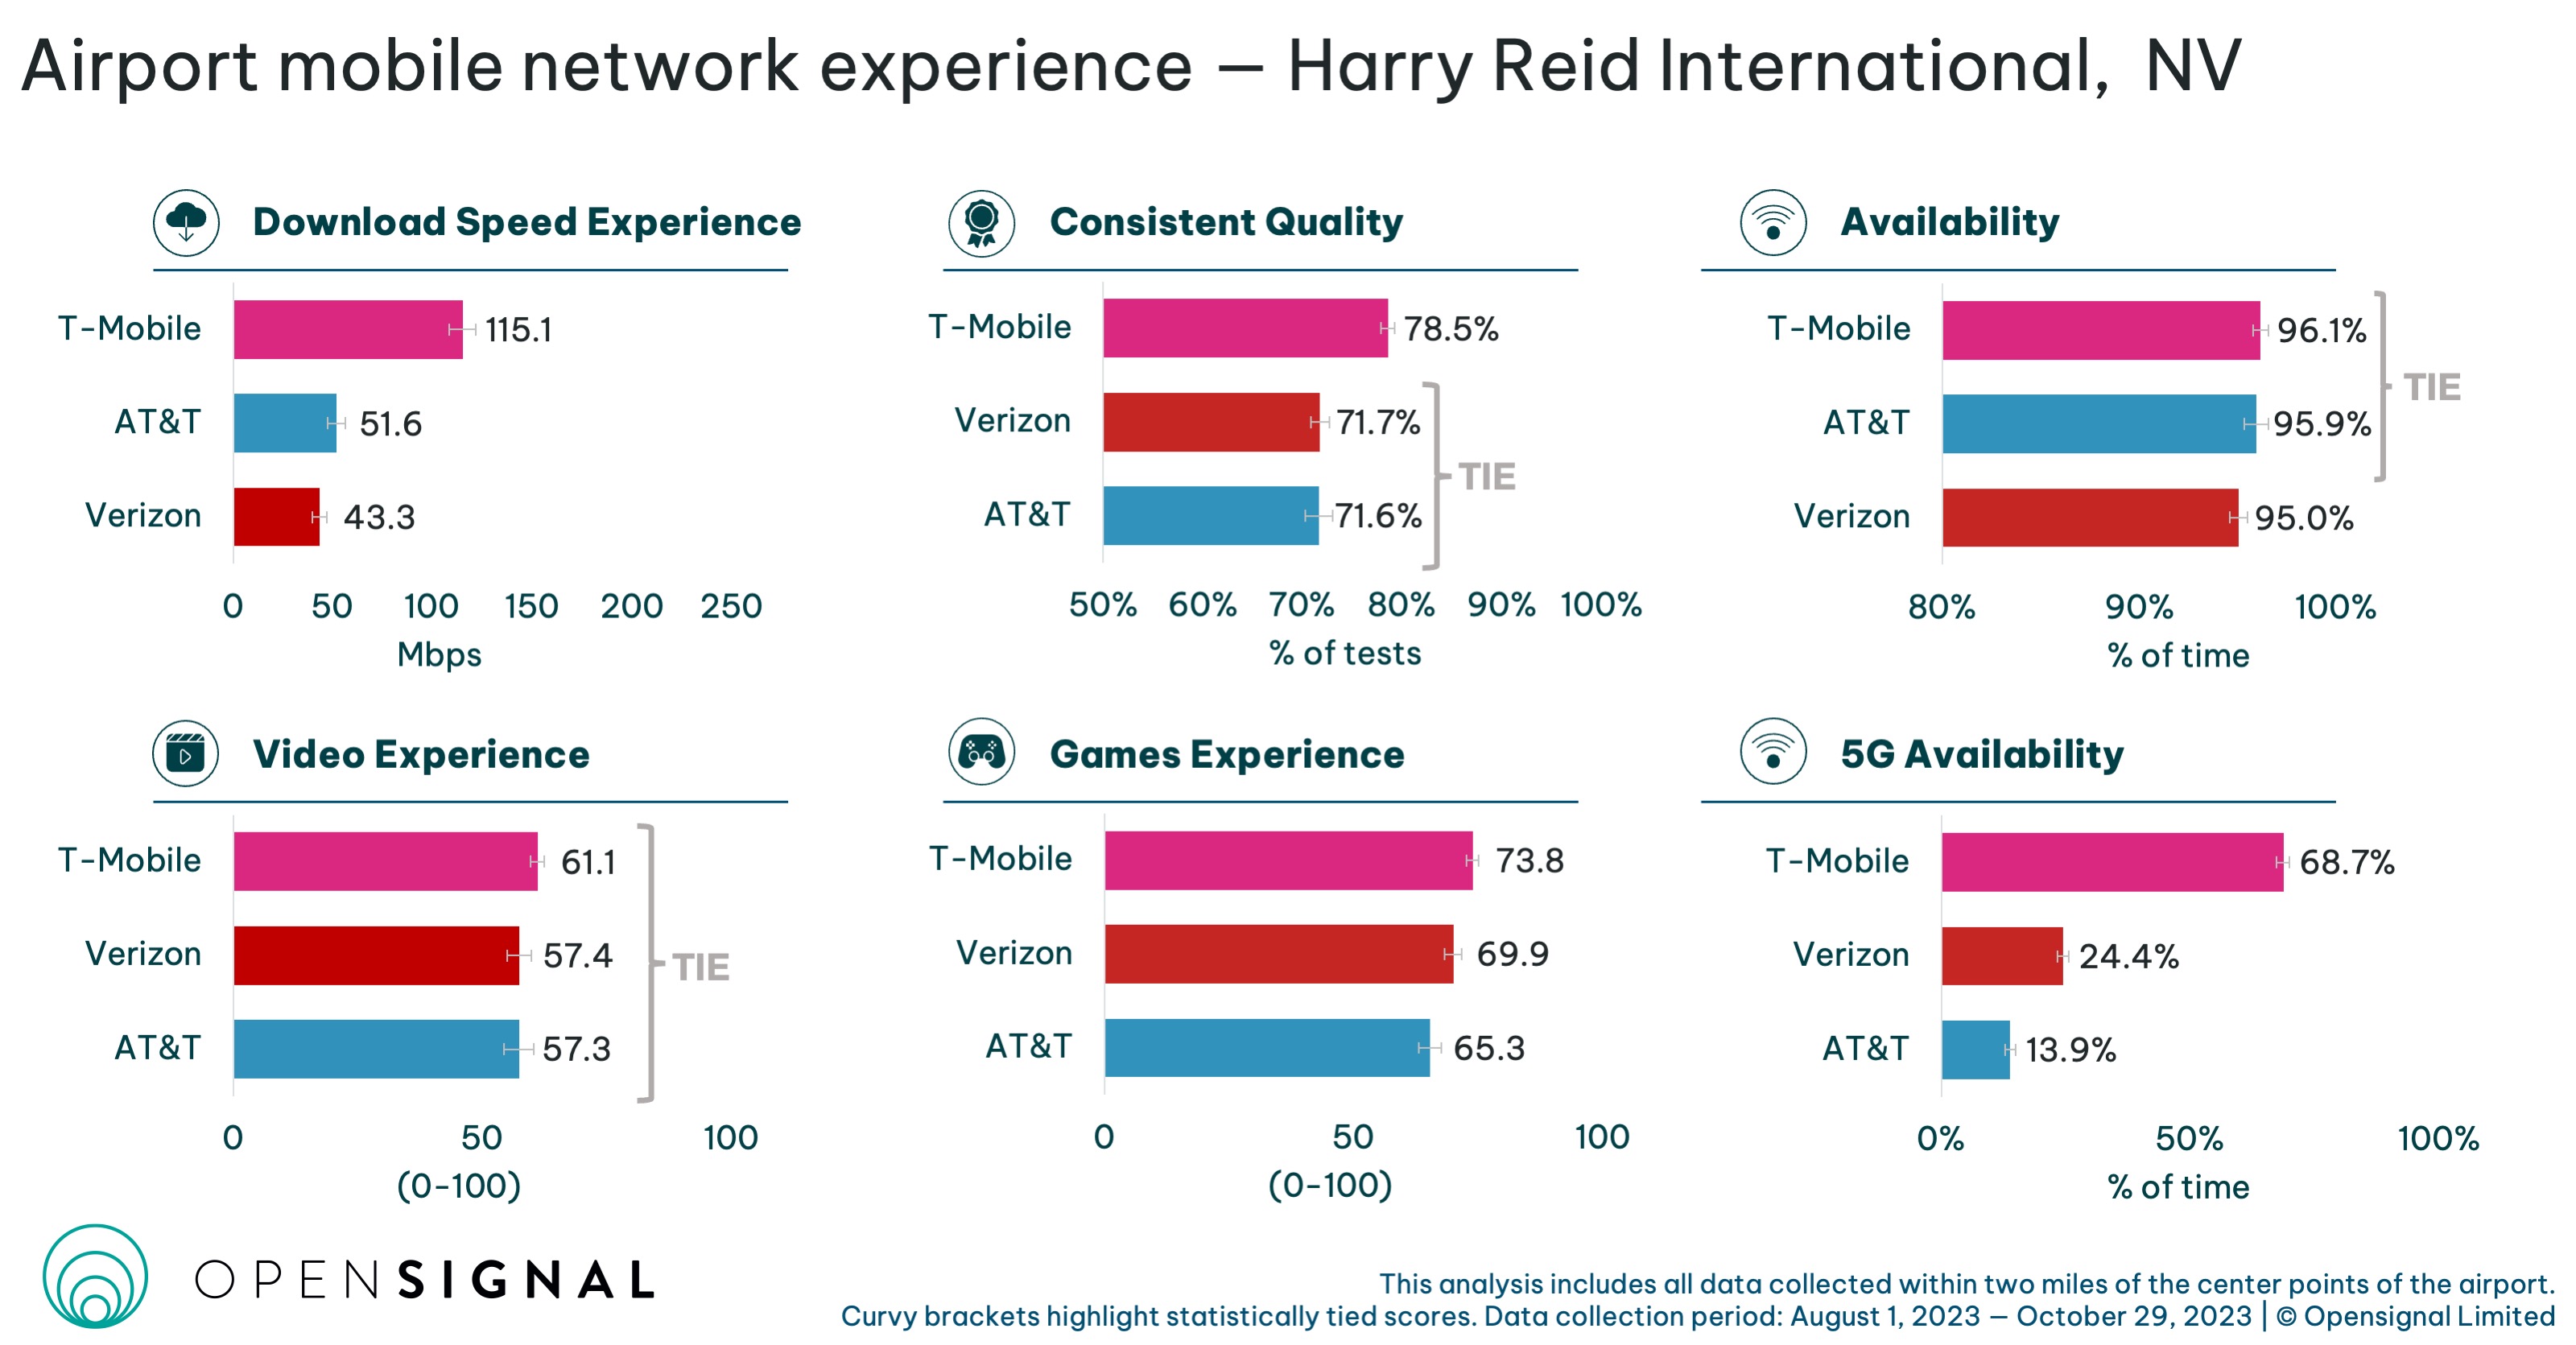
T-Mobile has the outright highest scores across four out of six metrics at Harry Reid International in Las Vegas. It scores the highest for Download Speed Experience — 115.1Mbps — which is 2.2 and 2.7 times as fast as what our AT&T users and Verizon users experience, respectively. T-Mobile also leads for Consistent Quality with a score of 78.5% – around 6.9 percentage points ahead of its statistically tied rivals.
T-Mobile has the highest score for Games Experience as well, 73.8 points on a 100-point scale,, beating Verizon by 3.9 points. T-Mobile reigns supreme for 5G Availability, with a score of 68.7%. The proportion of time that our 5G users on this network spend with an active 5G connection is 2.8 times greater than that seen by those on Verizon’s network and five times more than their AT&T peers.

T-Mobile has the outright highest scores in three out of six metrics at Hartsfield-Jackson Atlanta International — the busiest airport in the U.S. T-Mobile leads for Download Speed Experience with a score of 95.6Mbps, beating Verizon by 49.1Mbps and AT&T by 66.2Mbps. Our T-Mobile users enjoy the most consistent quality of mobile services around the Hartsfield-Jackson airport, as the carrier achieves a score of 72.3% for Consistent Quality.
T-Mobile also claims 5G Availability with a score of 52.2% — around thrice the time that Opensignal 5G users spend on Verizon and AT&T’s 5G networks. Meanwhile, Verizon comes first for Games Experience, with a score of 68.6 points on a 100-point scale — 3.2 points ahead of T-Mobile and eight points ahead of AT&T.
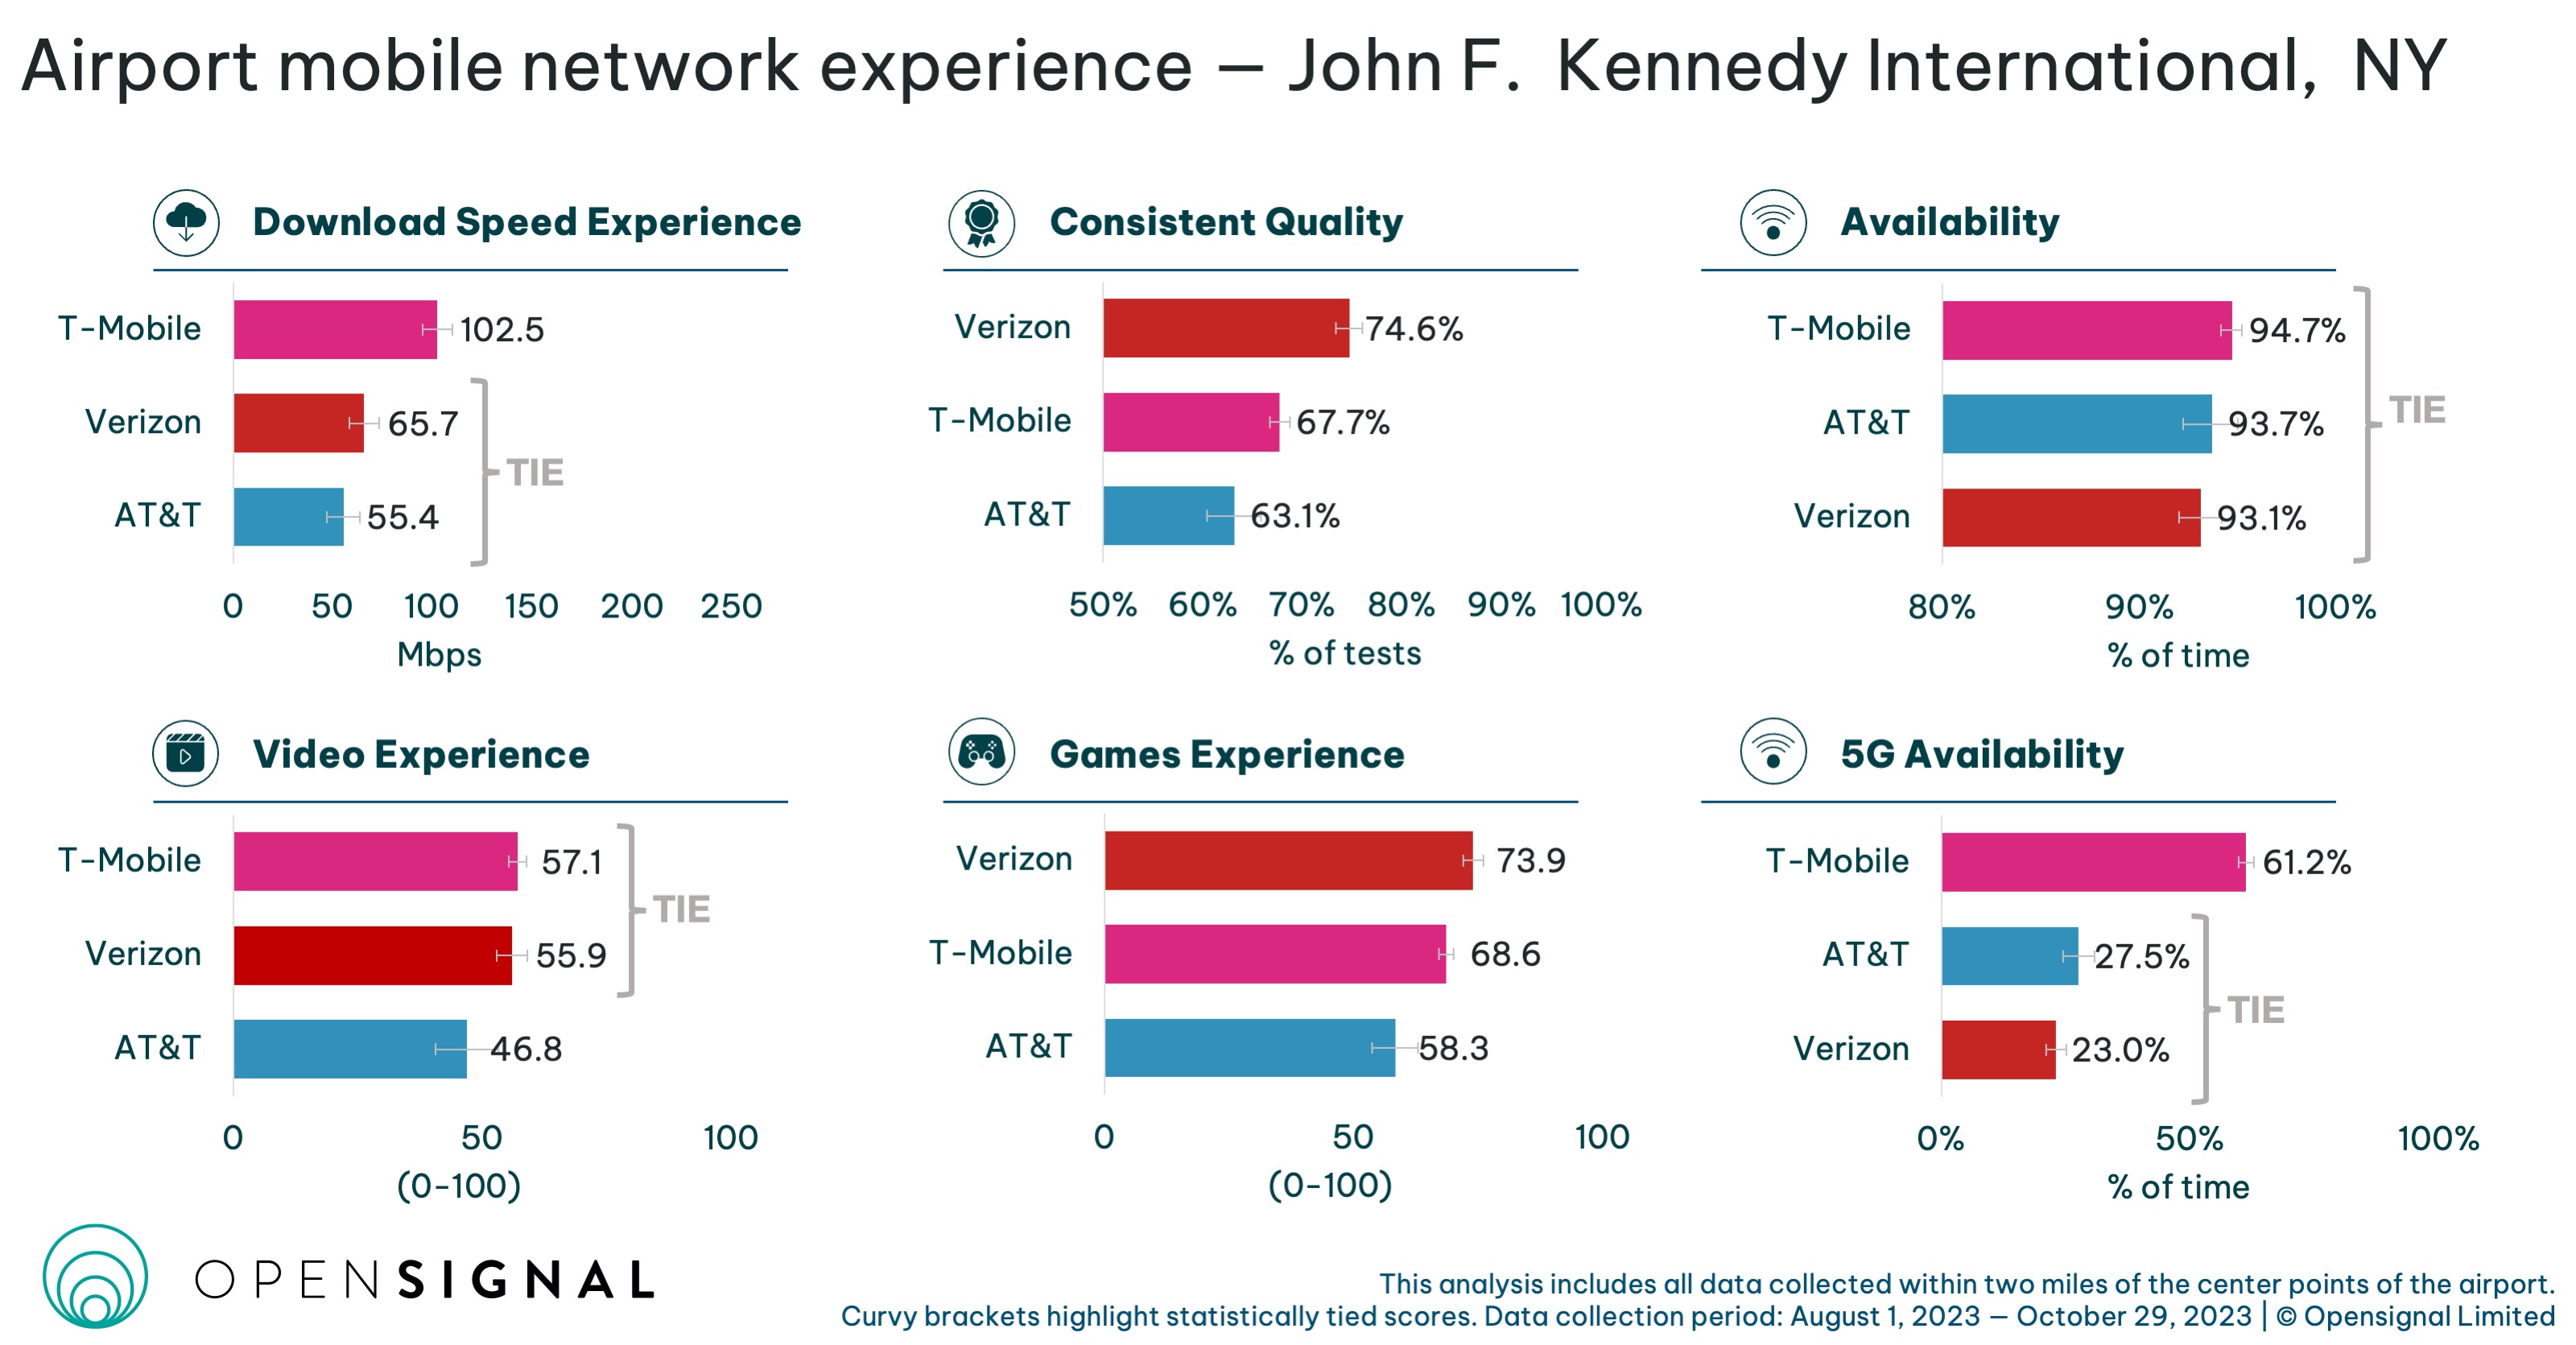
T-Mobile and Verizon have the outright highest scores in two categories each at the John F. Kennedy International Airport in New York City. T-Mobile leads for Download Speed Experience with a score of 102.5Mbps and for 5G Availability with 61.2%, commanding substantial leads over its statistically tied competitors.
However, Verizon shines for Consistent Quality and Games Experience, scoring 74.6% and 73.9 points on a 100-point scale, respectively.
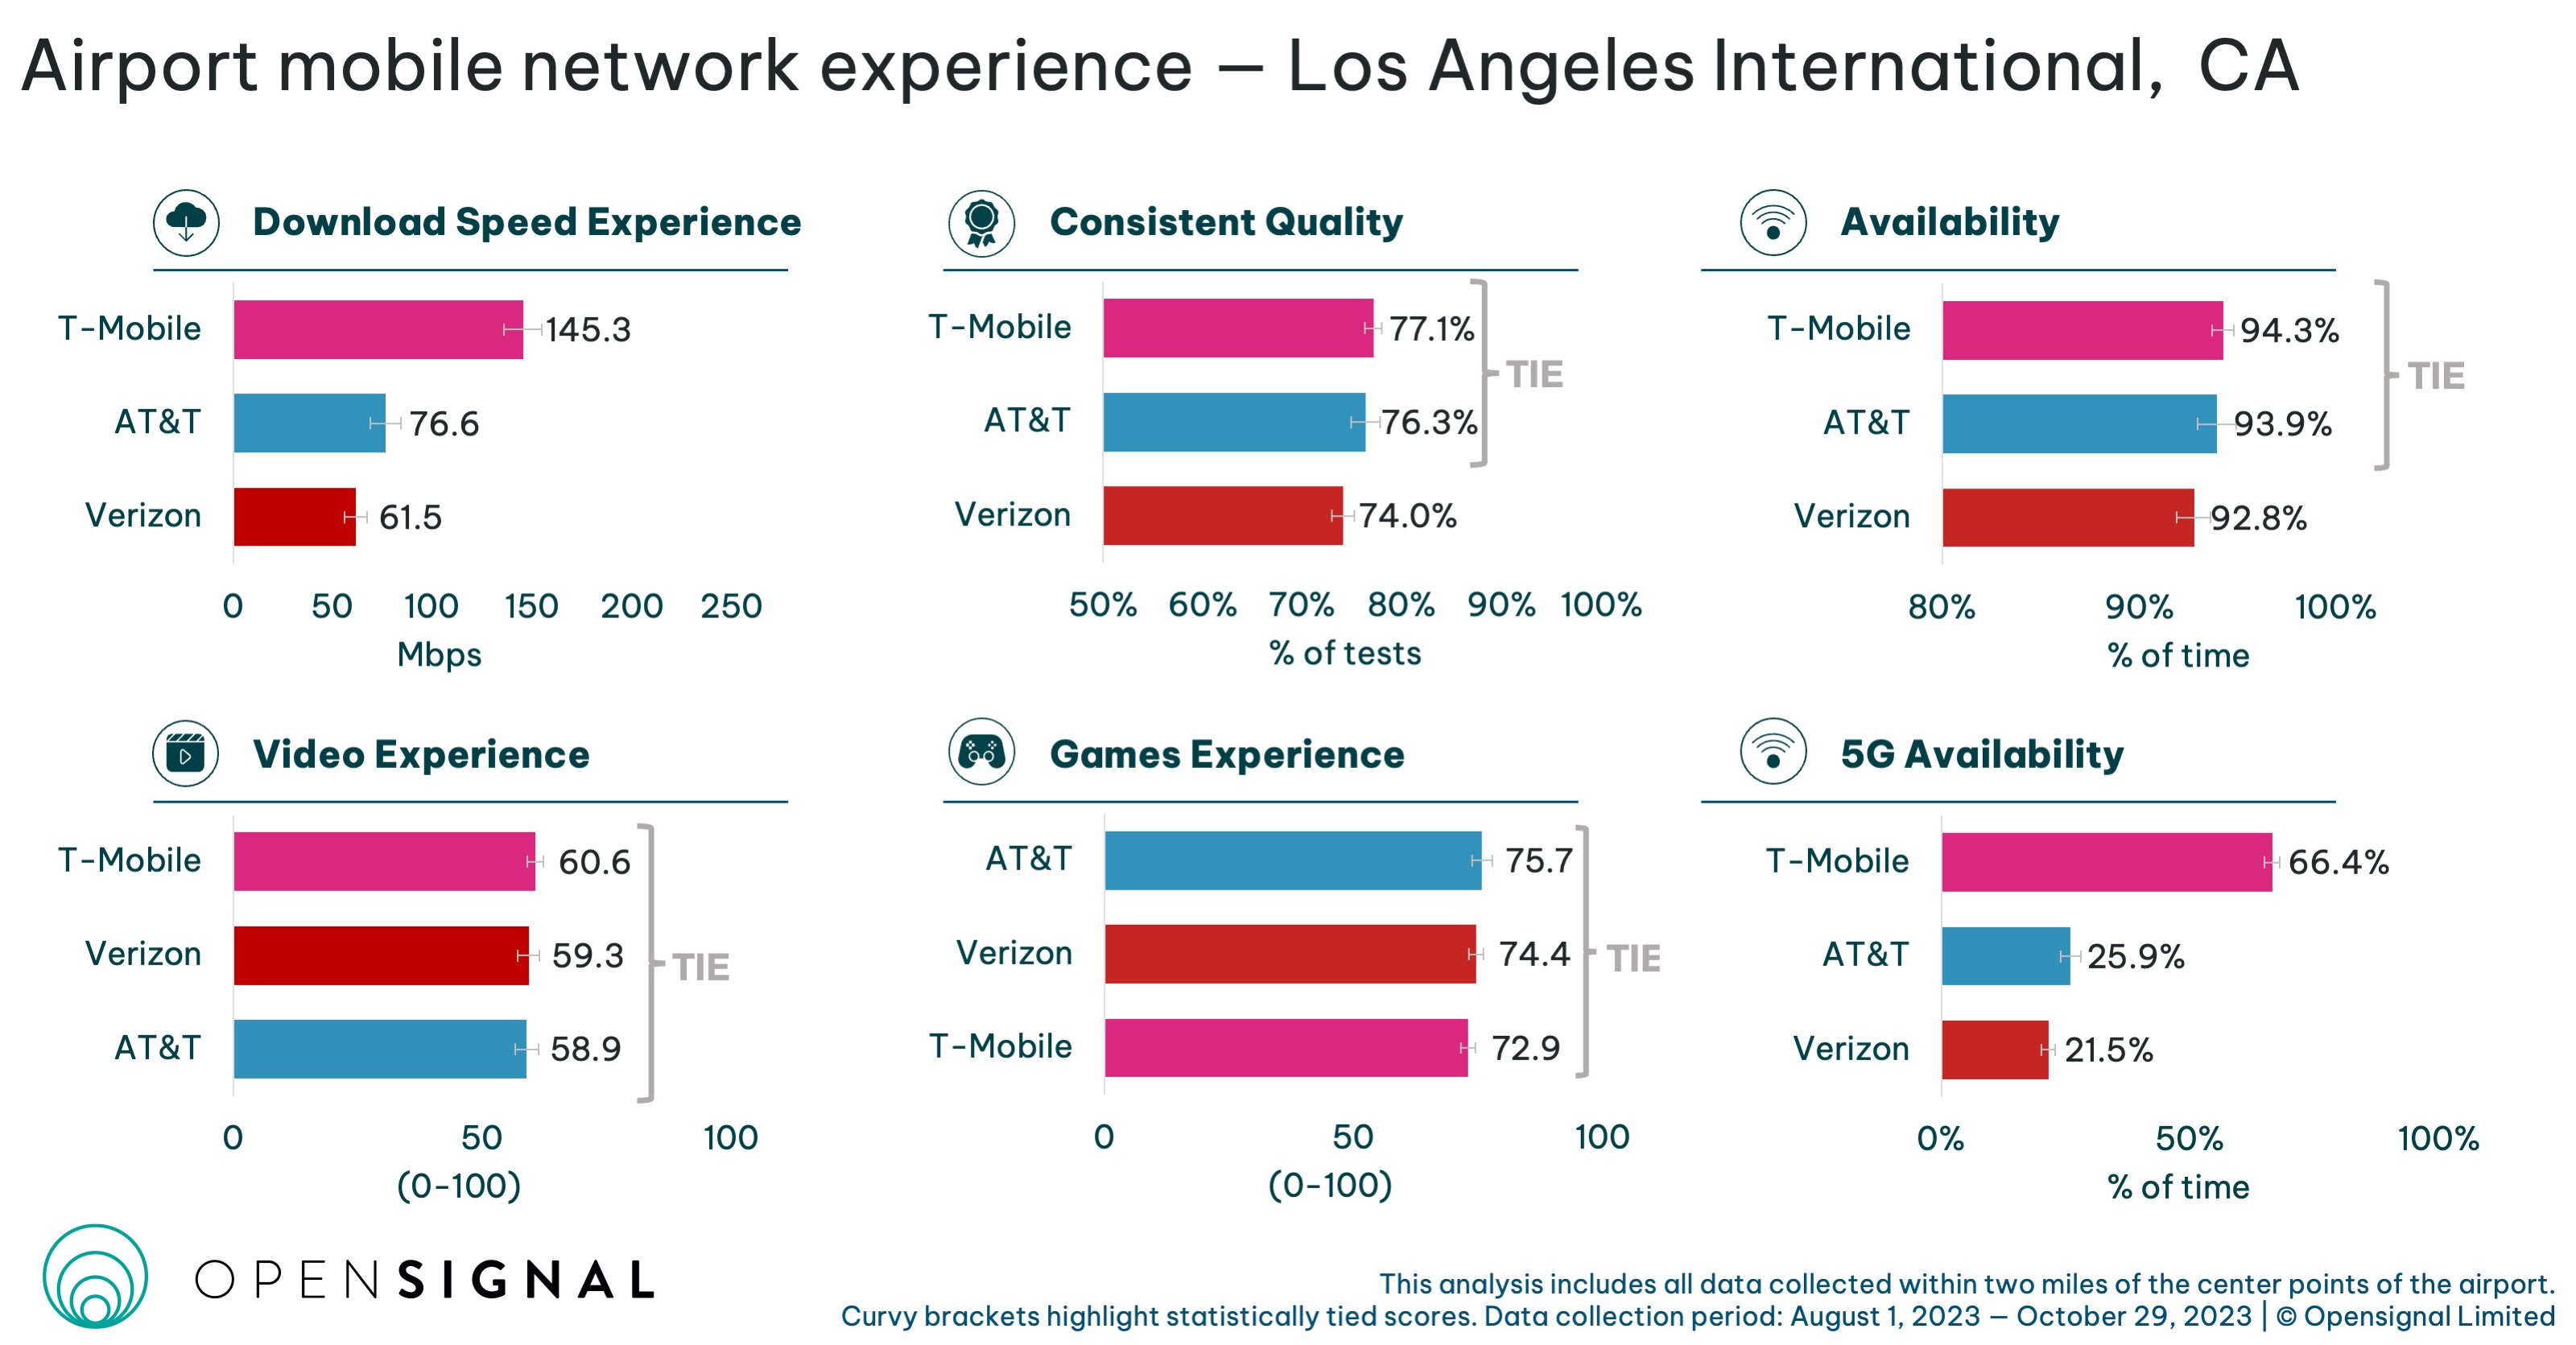
At Los Angeles International, T-Mobile comes first for Download Speed Experience with a score of 145.3Mbps. AT&T is the runner-up, 68.7Mbps behind the leader, while Verizon brings up the rear, with a score of 61.5Mbps. T-Mobile also leads for 5G Availability, with a score of 66.4% — 2.6 times higher than AT&T and 3.1 times higher than Verizon’s score. AT&T and T-Mobile are statistically tied for the highest scores for Consistent Quality and Availability.
All three carriers tie for Video Experience and Games Experience. For Video Experience, they all place in the Good (58-68) category. This means our users, on average, are able to stream video at 720p or better with satisfactory loading times and little stalling.
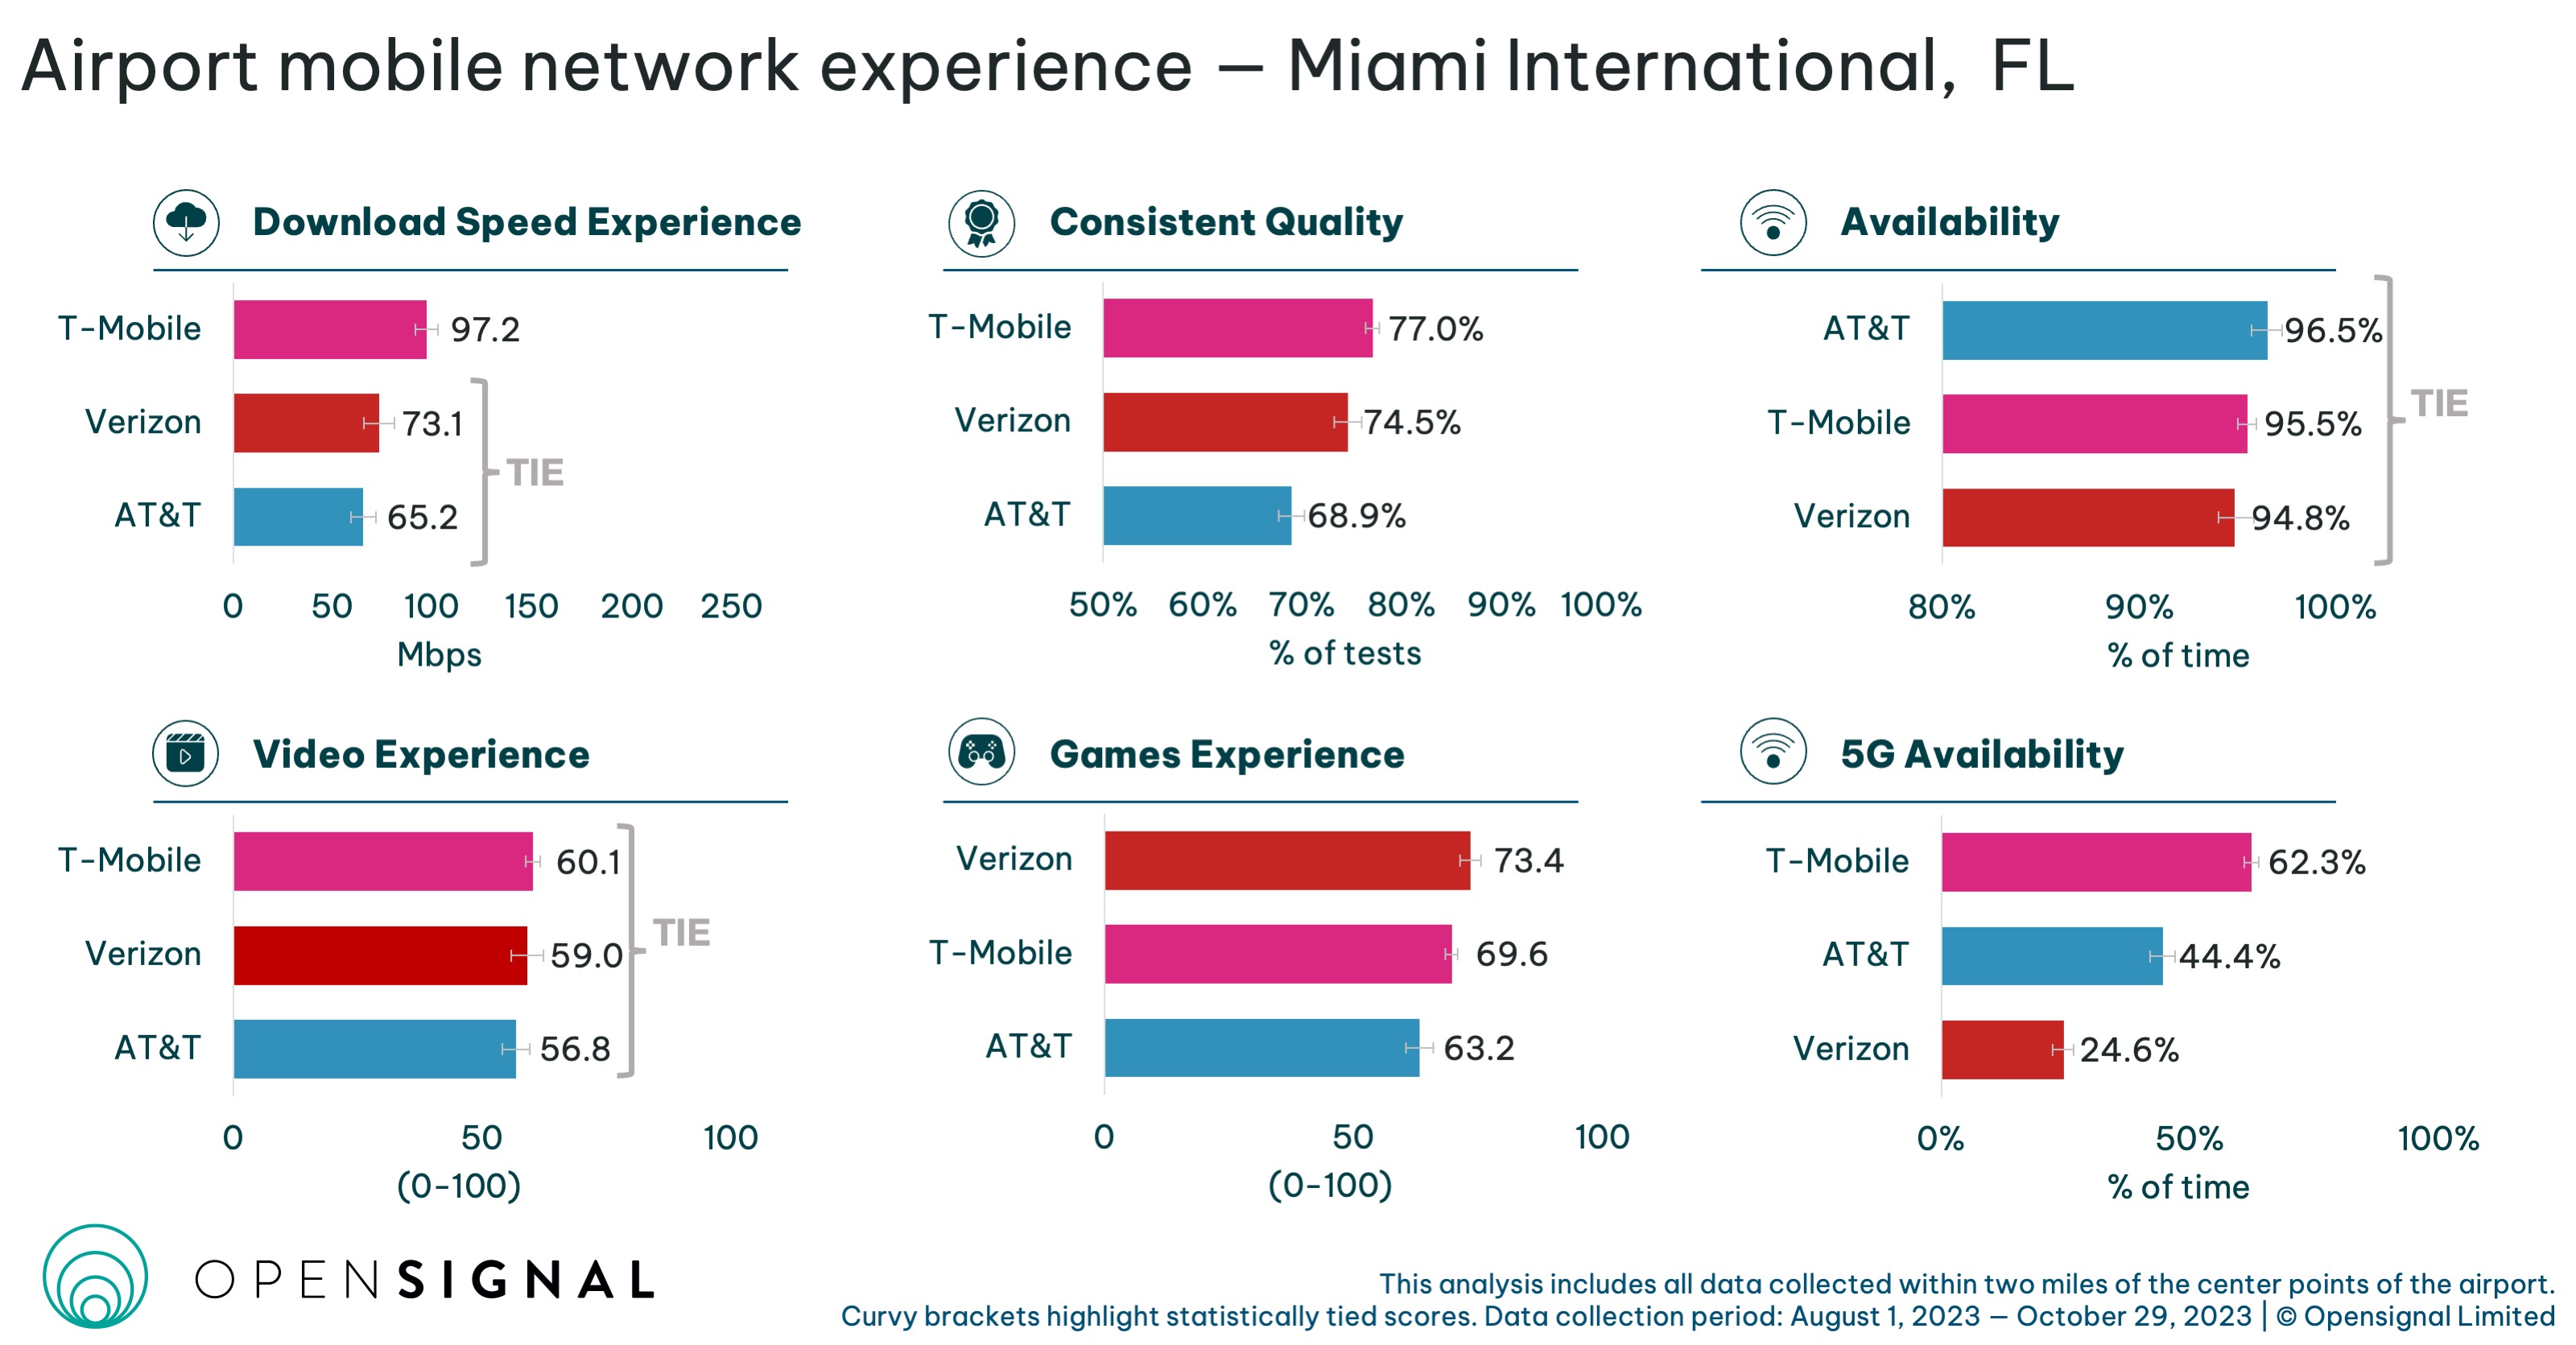
T-Mobile has the outright highest scores across three out of six metrics at Miami International. Opensignal users on this network enjoy the fastest average download speeds — clocking in at 97.2Mbps — and the most consistent quality of mobile services, scoring at 77%. Our T-Mobile 5G users connect to 5G services for the greatest proportion of time — 62.3% — while AT&T is the runner-up in this category, 17.9 percentage points behind the highest scorer. Verizon achieves the best result for Games Experience — 73.4 points on a 100-point scale.
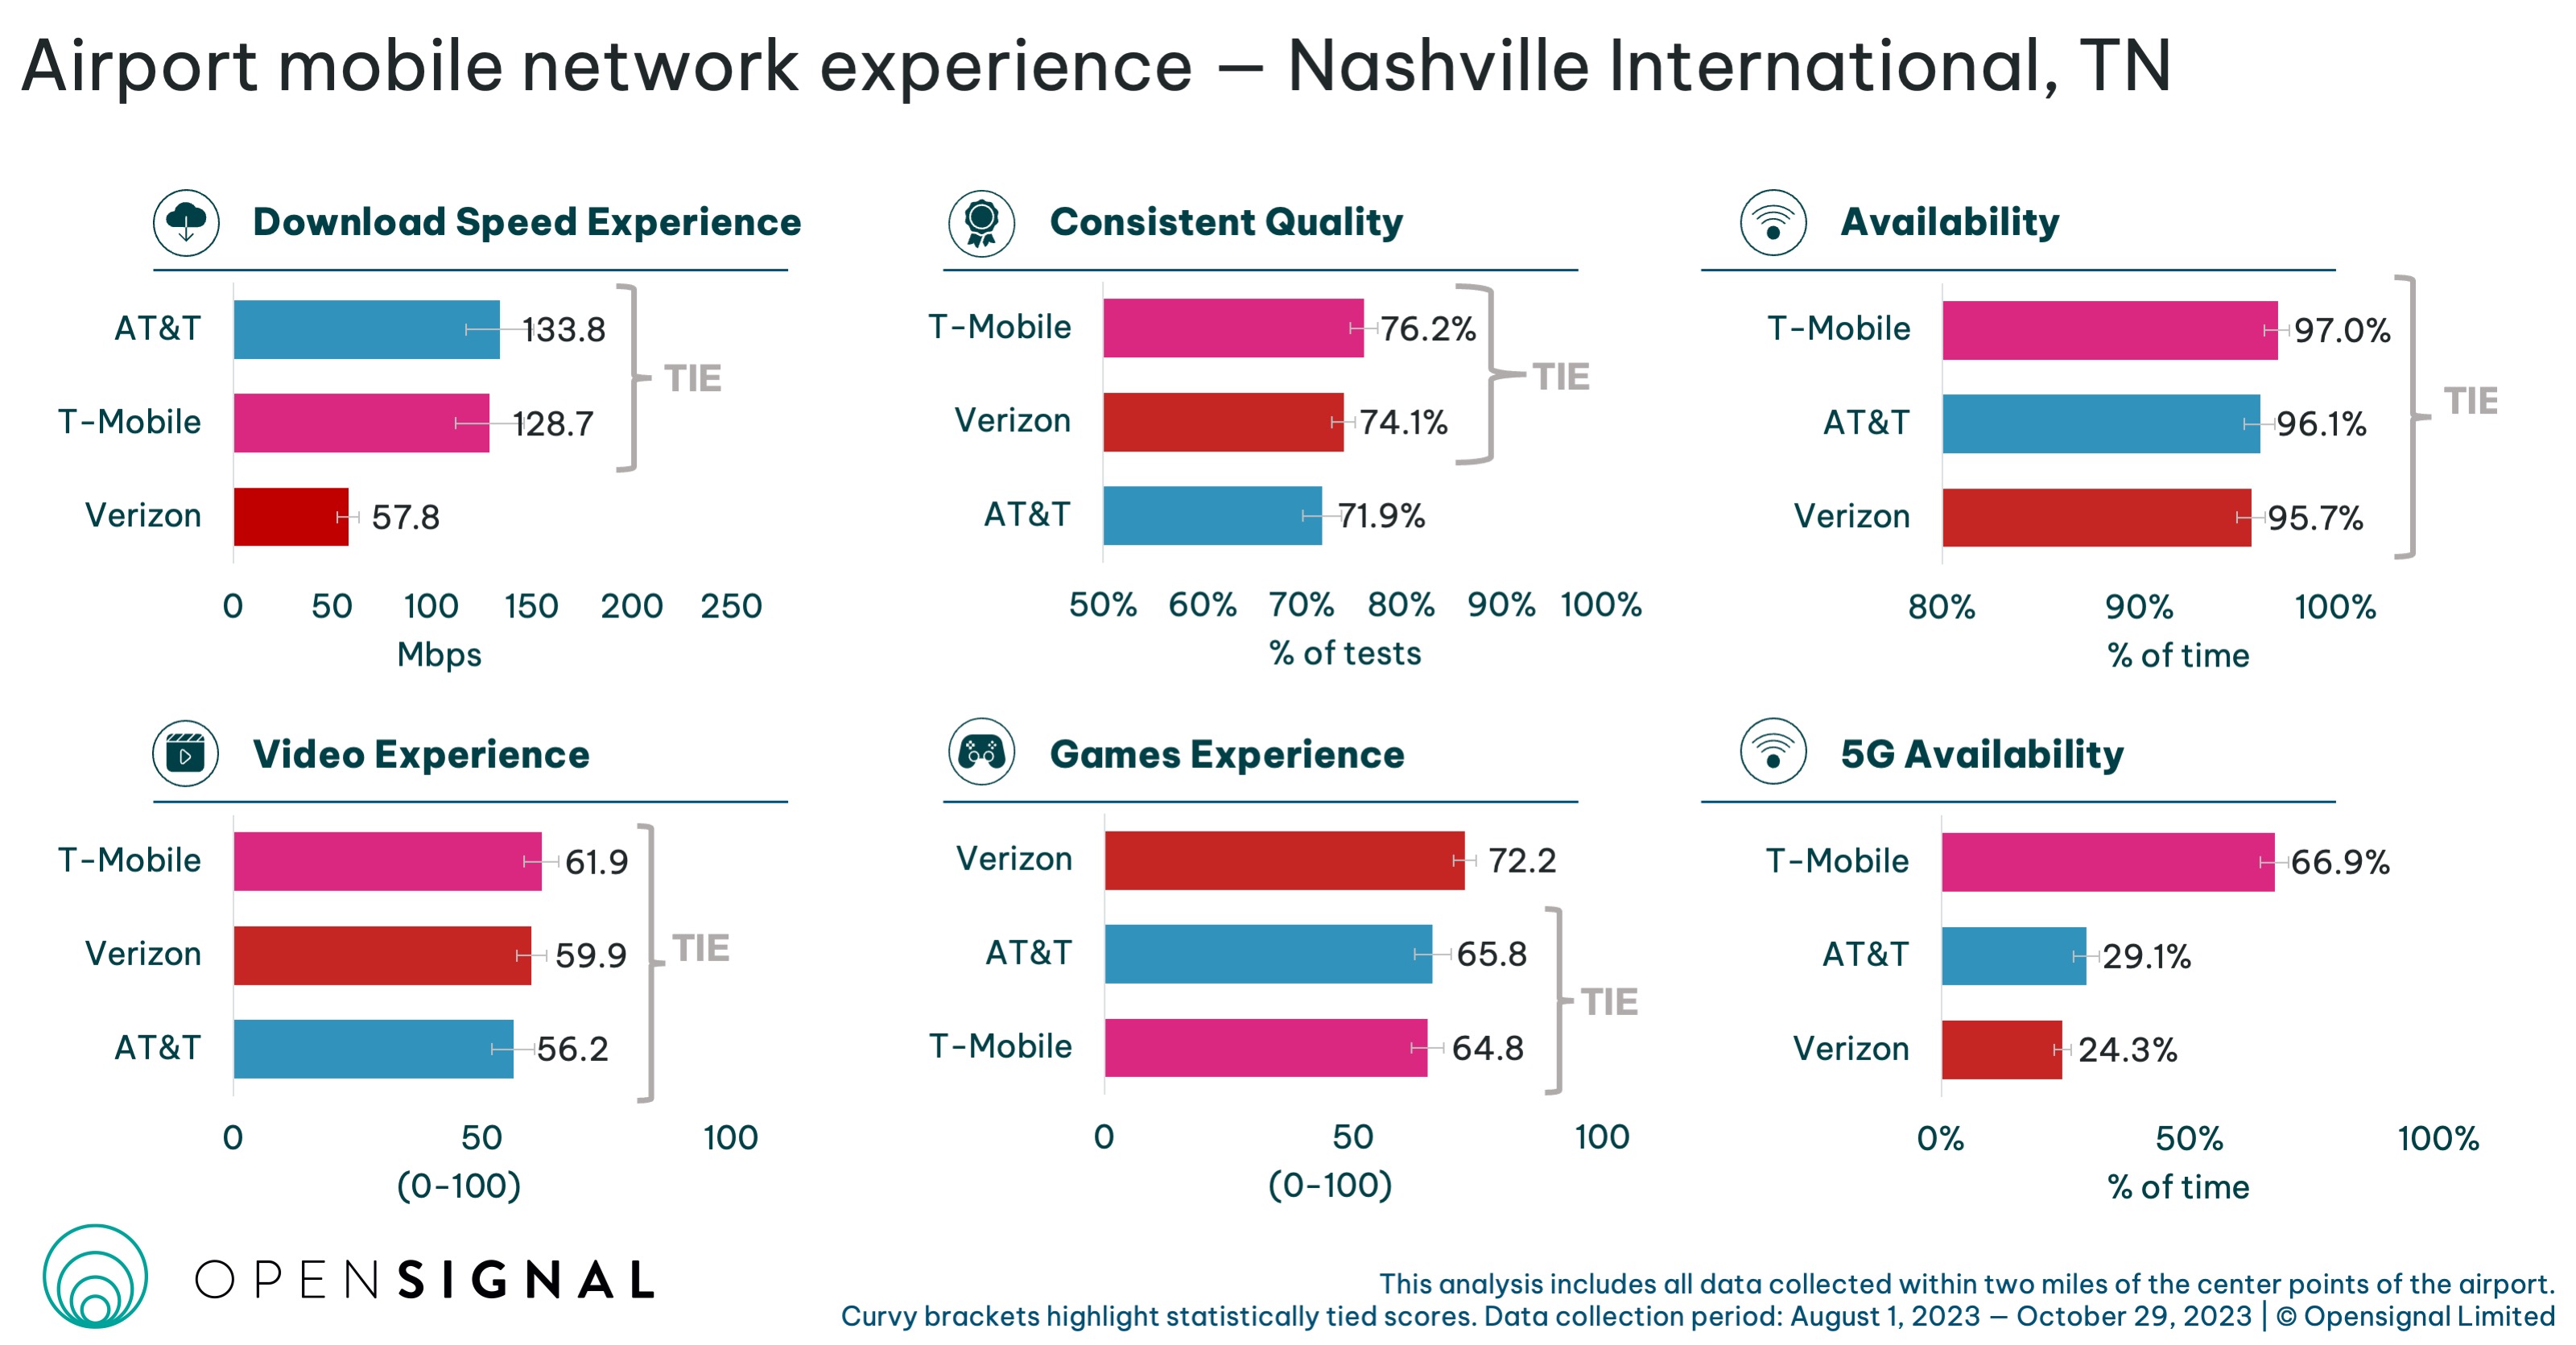
AT&T and T-Mobile have the joint highest scores for Download Speed Experience at Nashville International, in the 128.7-133.8Mbps range. T-Mobile and Verizon share first place for Consistent Quality with statistically tied scores of 72.2-76.2% — around 3.2 percentage points ahead of AT&T.
Verizon places first for Games Experience with a score of 72.2 points on a 100-point scale. Meanwhile, T-Mobile comes first for 5G Availability with a score of 66.9% — 2.3 times higher than AT&T and 2.8 times higher than Verizon.

AT&T and T-Mobile tie for the top spot of Download Speed Experience at Newark Liberty International, with scores of 83.5-93.7Mbps. T-Mobile places first for Consistent Quality with a score of 79.3% and for 5G Availability with a score of 58%. Verizon and T-Mobile are statistically tied for first place for both experiential metrics — Video Experience and Games Experience — while all three carriers tie for Availability.
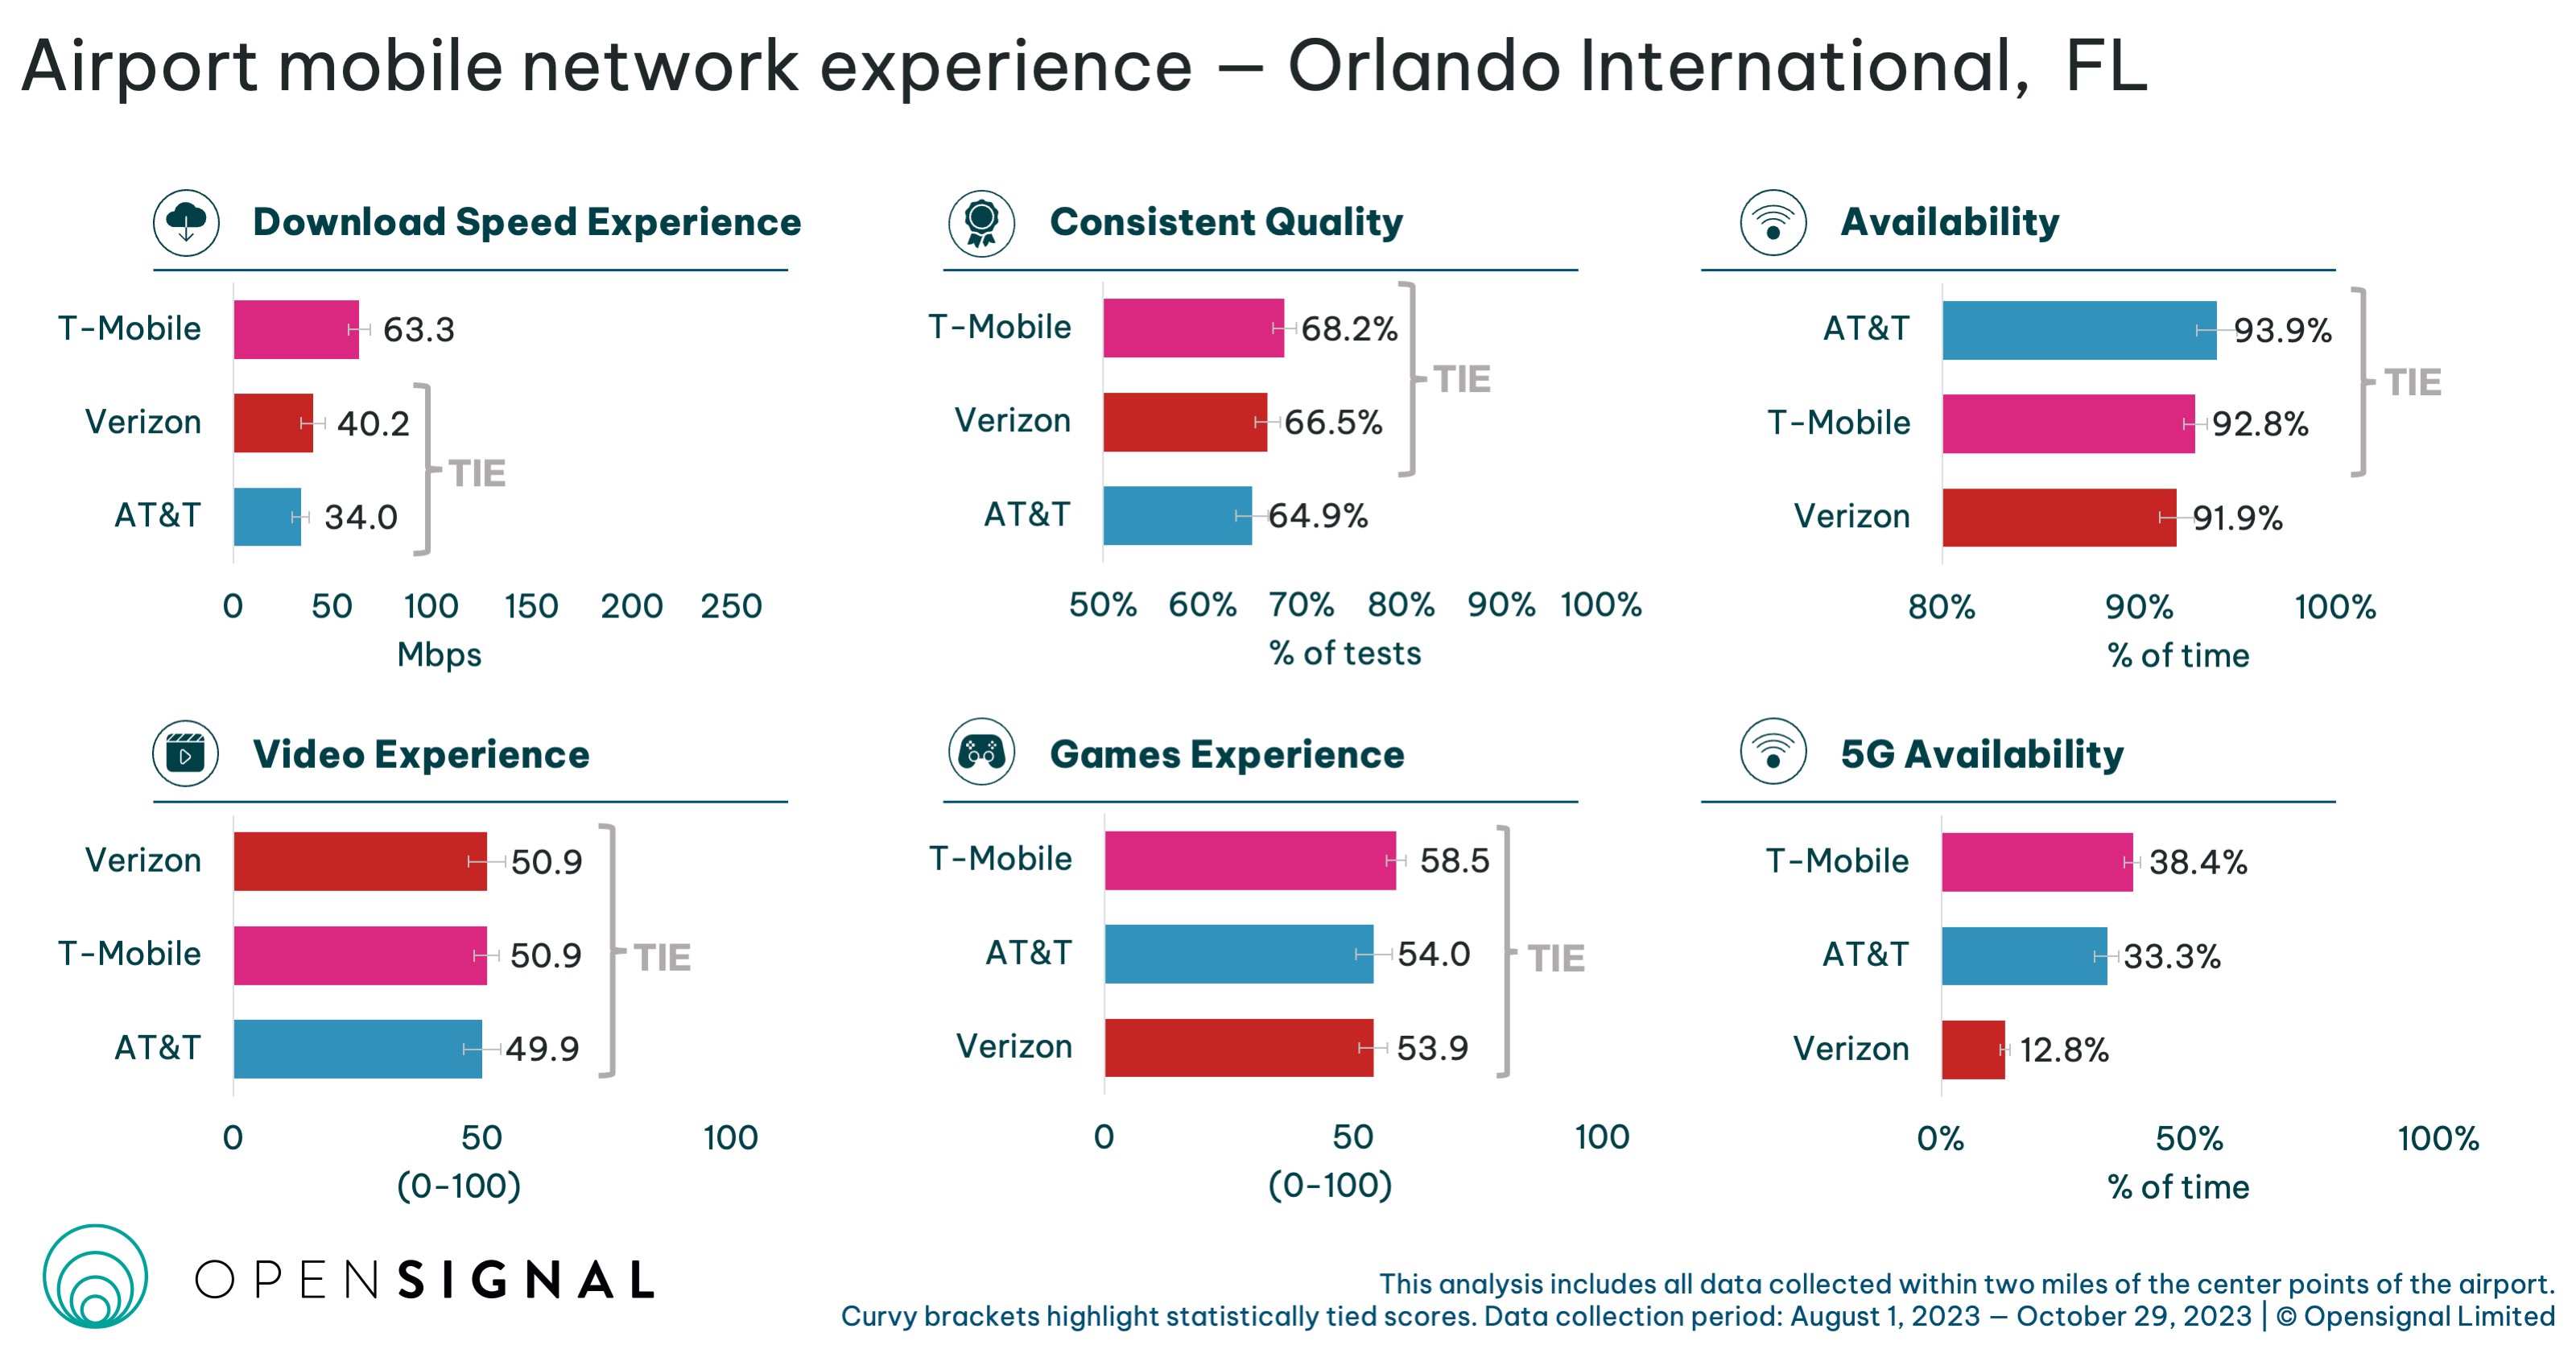
T-Mobile comes outright first for two metrics at Orlando International. Download Speed Experience, it leads with a score of 63.3Mbps — more than 70% faster than AT&T and Verizon which are in a statistical tie for second place.
T-Mobile also leads for 5G Availability with a score of 38.4% — but AT&T is hot on its heels, only 5.2 percentage points behind the highest score. This is the lowest lead that T-Mobile commands over the second-placed competitors for 5G Availability across all 20 analyzed airports. Verizon brings up the rear with a score of 12.8%.

T-Mobile leads for Download Speed Experience at Phoenix Sky Harbor International with a score of 124.9Mbps — more than 90% ahead of statistically tied AT&T and Verizon. T-Mobile also takes first place for 5G Availability, with a score of 72.5%, one of the highest results across the analyzed airports.
Verizon places first for Games Experience with a score of 77.2 points on a 100-point scale and comes second for 5G Availability with a score of 26.2%. It is the only carrier at Phoenix Sky Harbor to rate as Good (75-85) for Games Experience — most users deem the experience acceptable and do not experience a delay between their actions and the game.
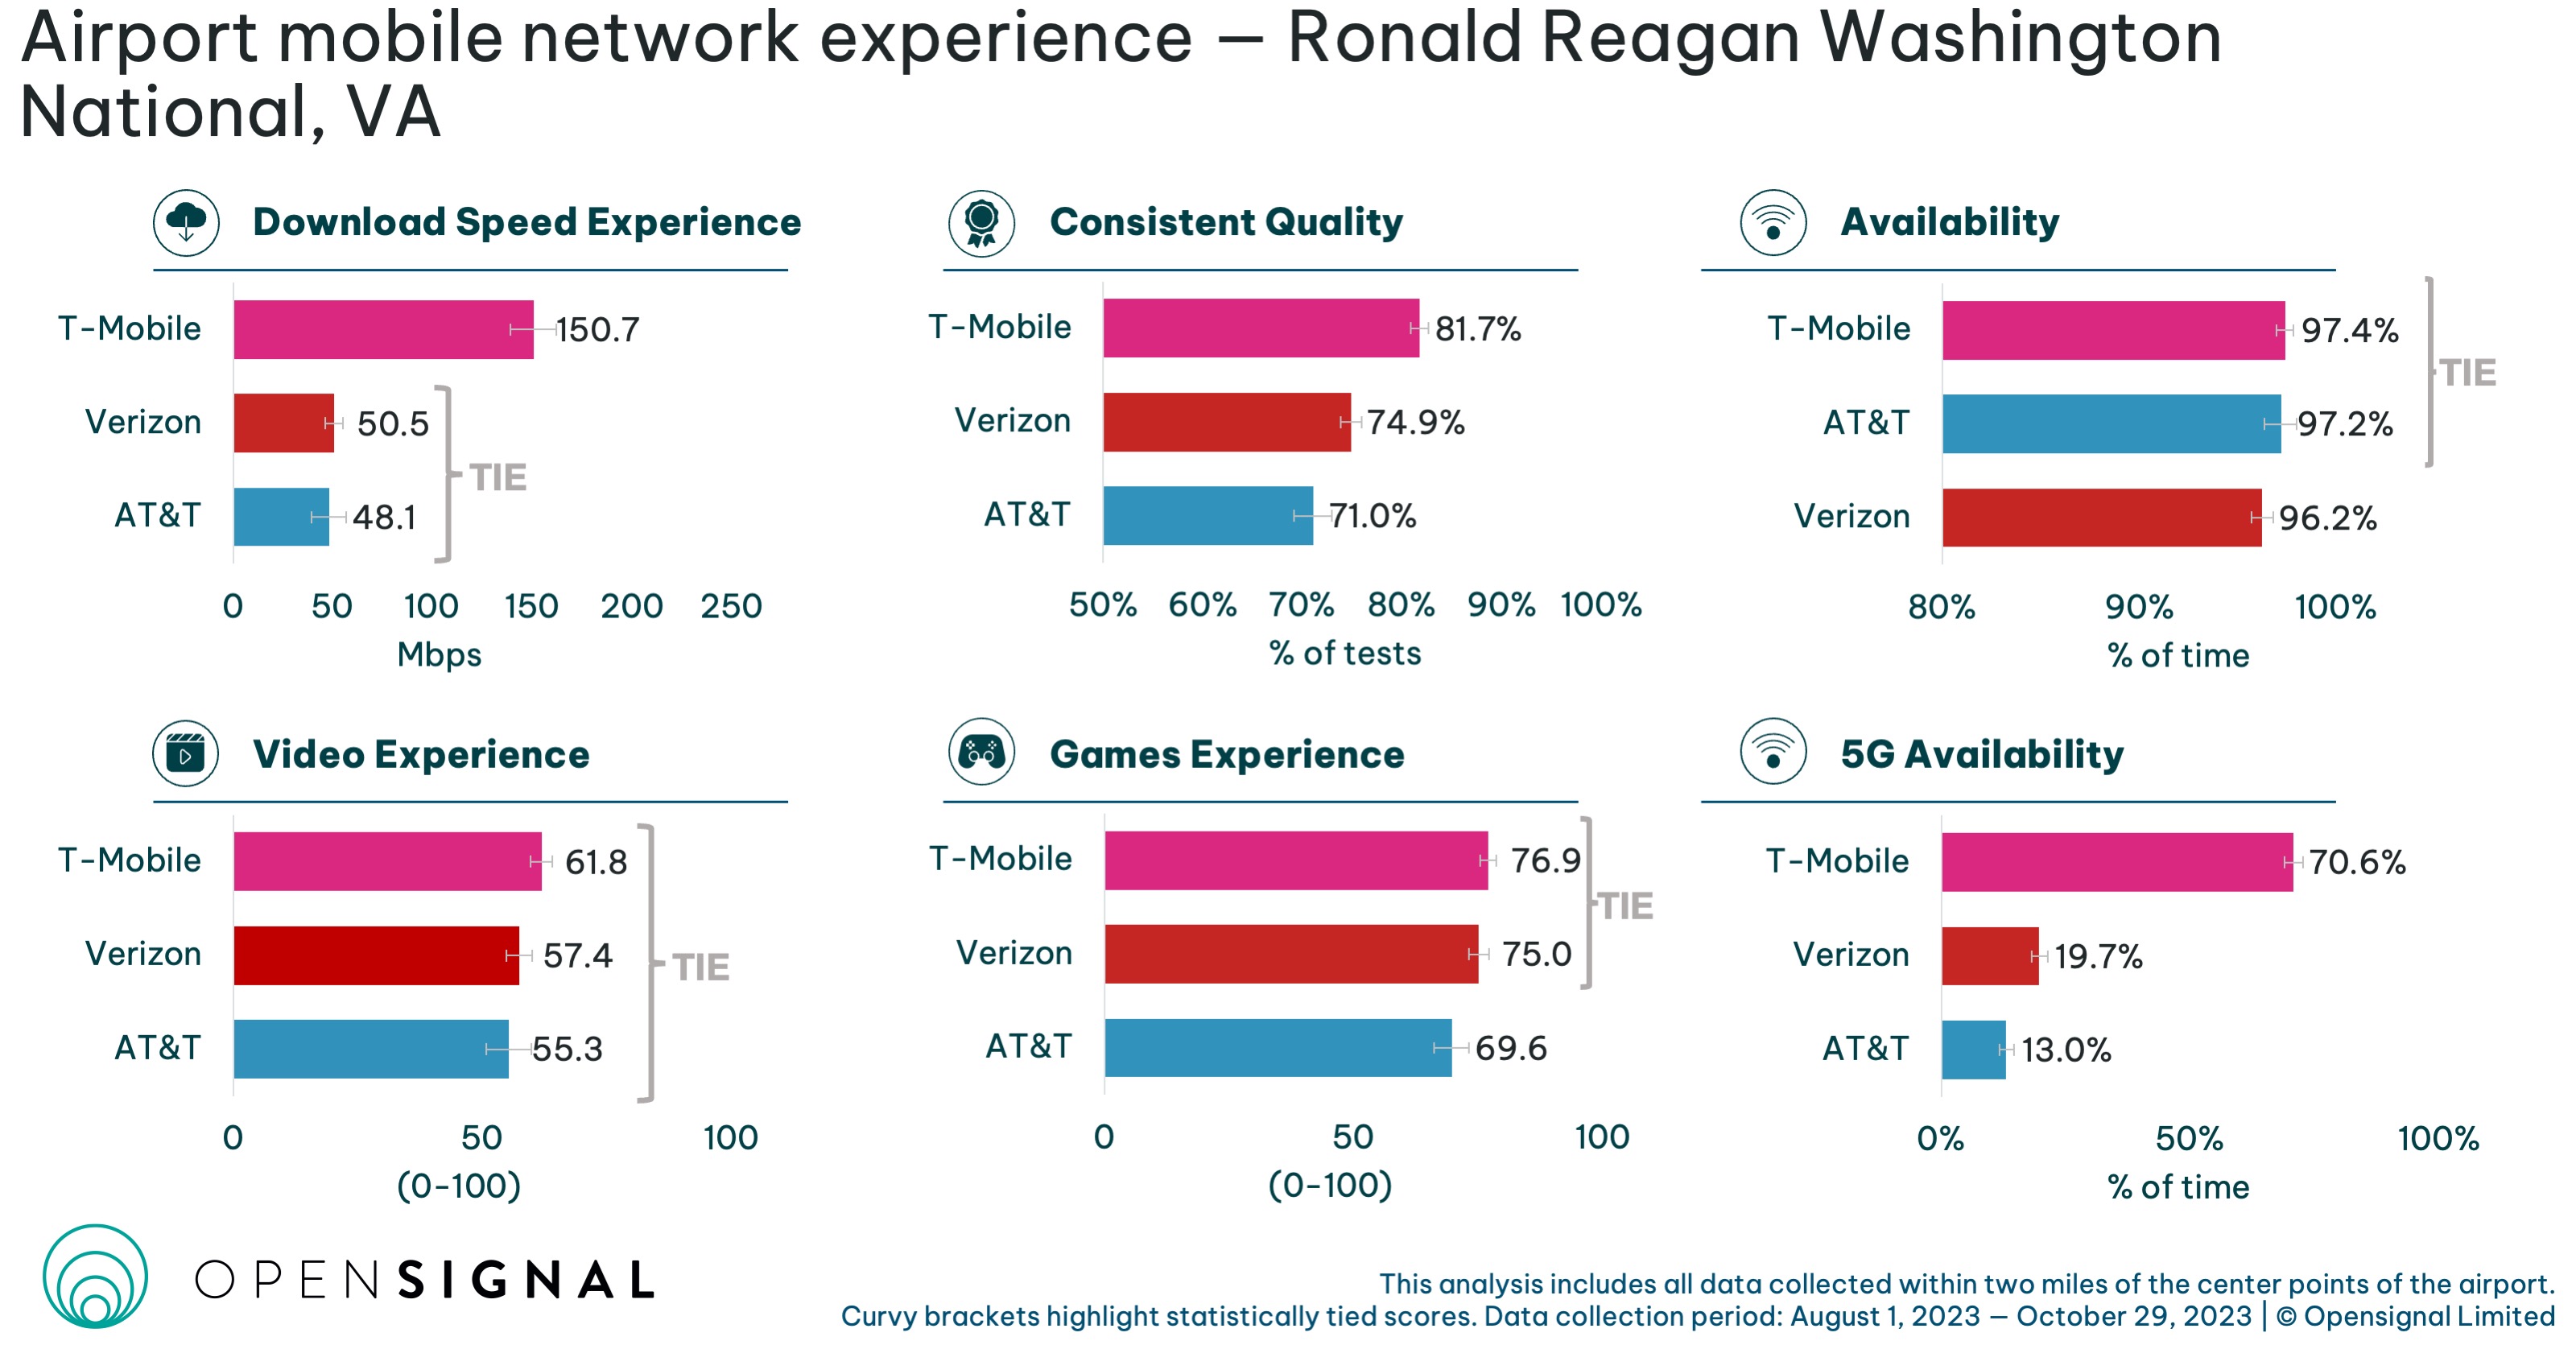
At the Reagan National Airport in Arlington, T-Mobile comes first outright for Download Speed Experience, Consistent Quality, and 5G Availability. Our T-Mobile users enjoy the fastest average overall download speeds at this airport, clocking in at 150.7Mbps — around three times faster than what their peers on statistically tied AT&T and Verizon observe.
T-Mobile leads for Consistent Quality with a score of 81.7% — the highest result across all analyzed airports. T-Mobile also has the highest score for 5G Availability, of 70.6% — the only airport aside from Phoenix Sky Harbor where T-Mobile hits the 70% milestone. Our 5G users on T-Mobile’s network spend 3.6 times more time connected to 5G services than those on Verizon’s network and 5.4 times more than those on AT&T’s network. AT&T and T-Mobile have the joint highest scores for Availability — and Reagan National has one of the highest Availability scores across all analyzed airports.
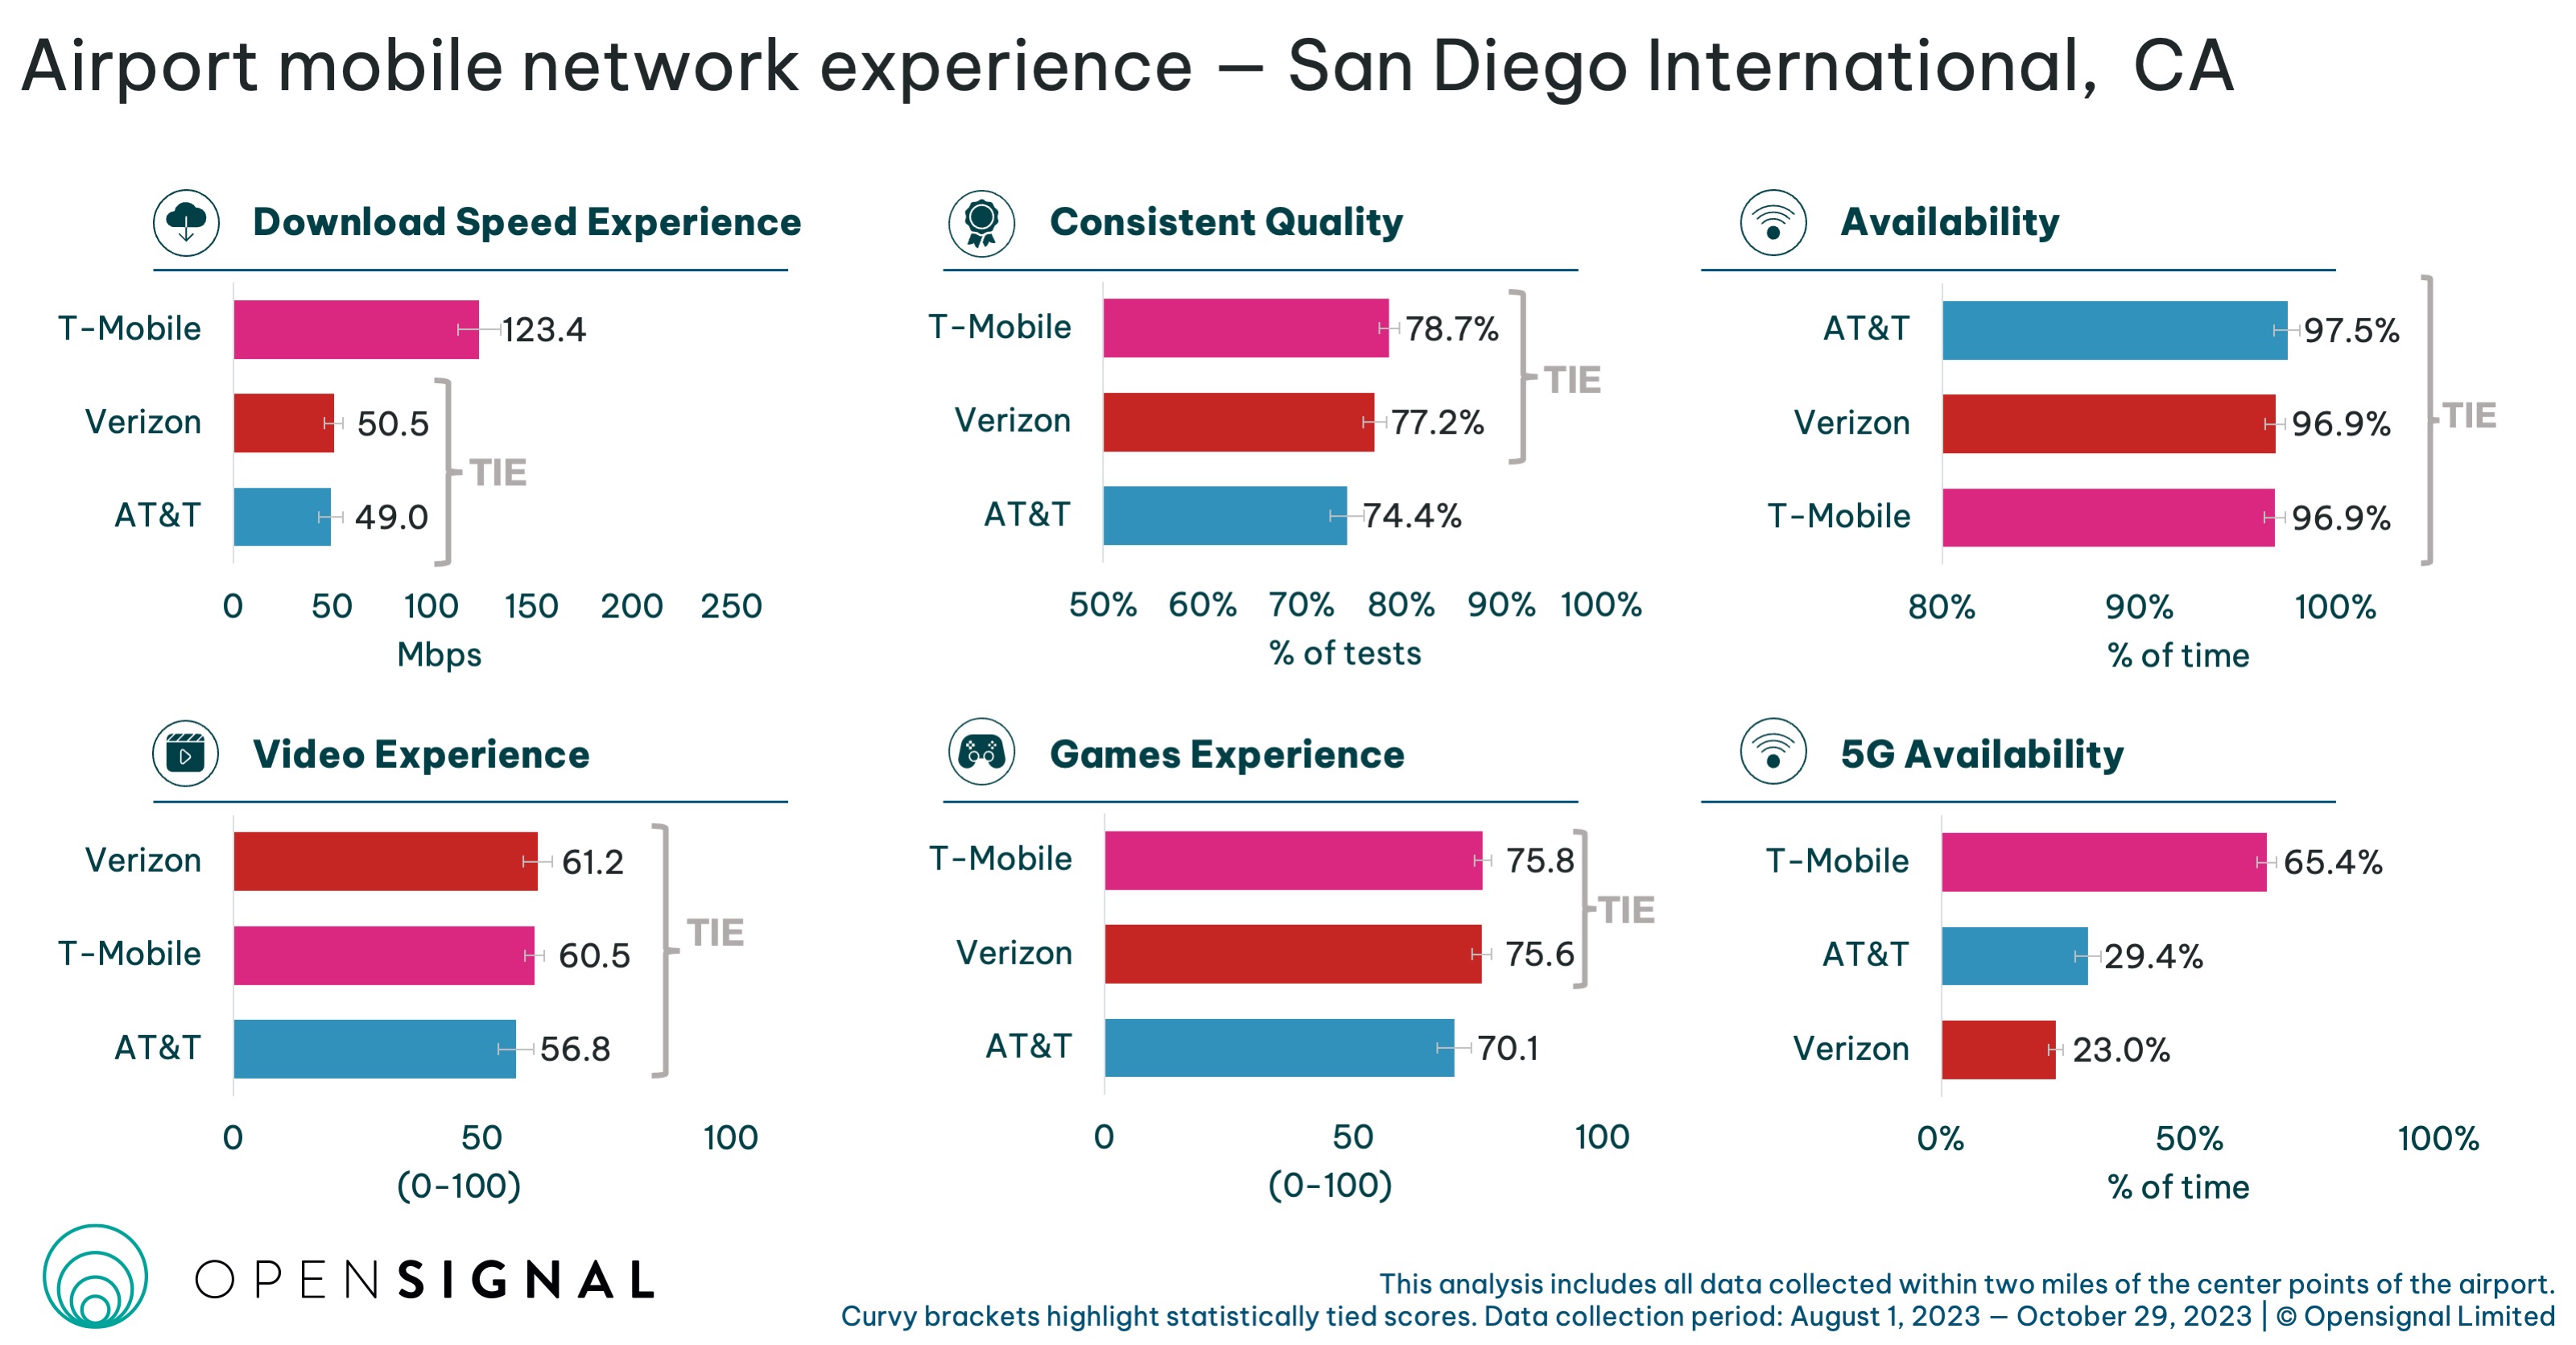
T-Mobile leads for Download Speed Experience at San Diego International, with a score of 123.4Mbps — this is around 2.5 times faster than what our users on statistically tied AT&T and Verizon see. T-Mobile also has the highest score for 5G Availability, of 65.4% — 35.9 percentage points ahead of the runner-up AT&T and 42.3 percentage points ahead of third-placed Verizon.
T-Mobile and Verizon are joint highest scorers for Consistent Quality and Games Experience. While all three carriers are in a statistical tie for Availability — our users at San Diego International see some of the highest Availability scores across all analyzed U.S. airports.
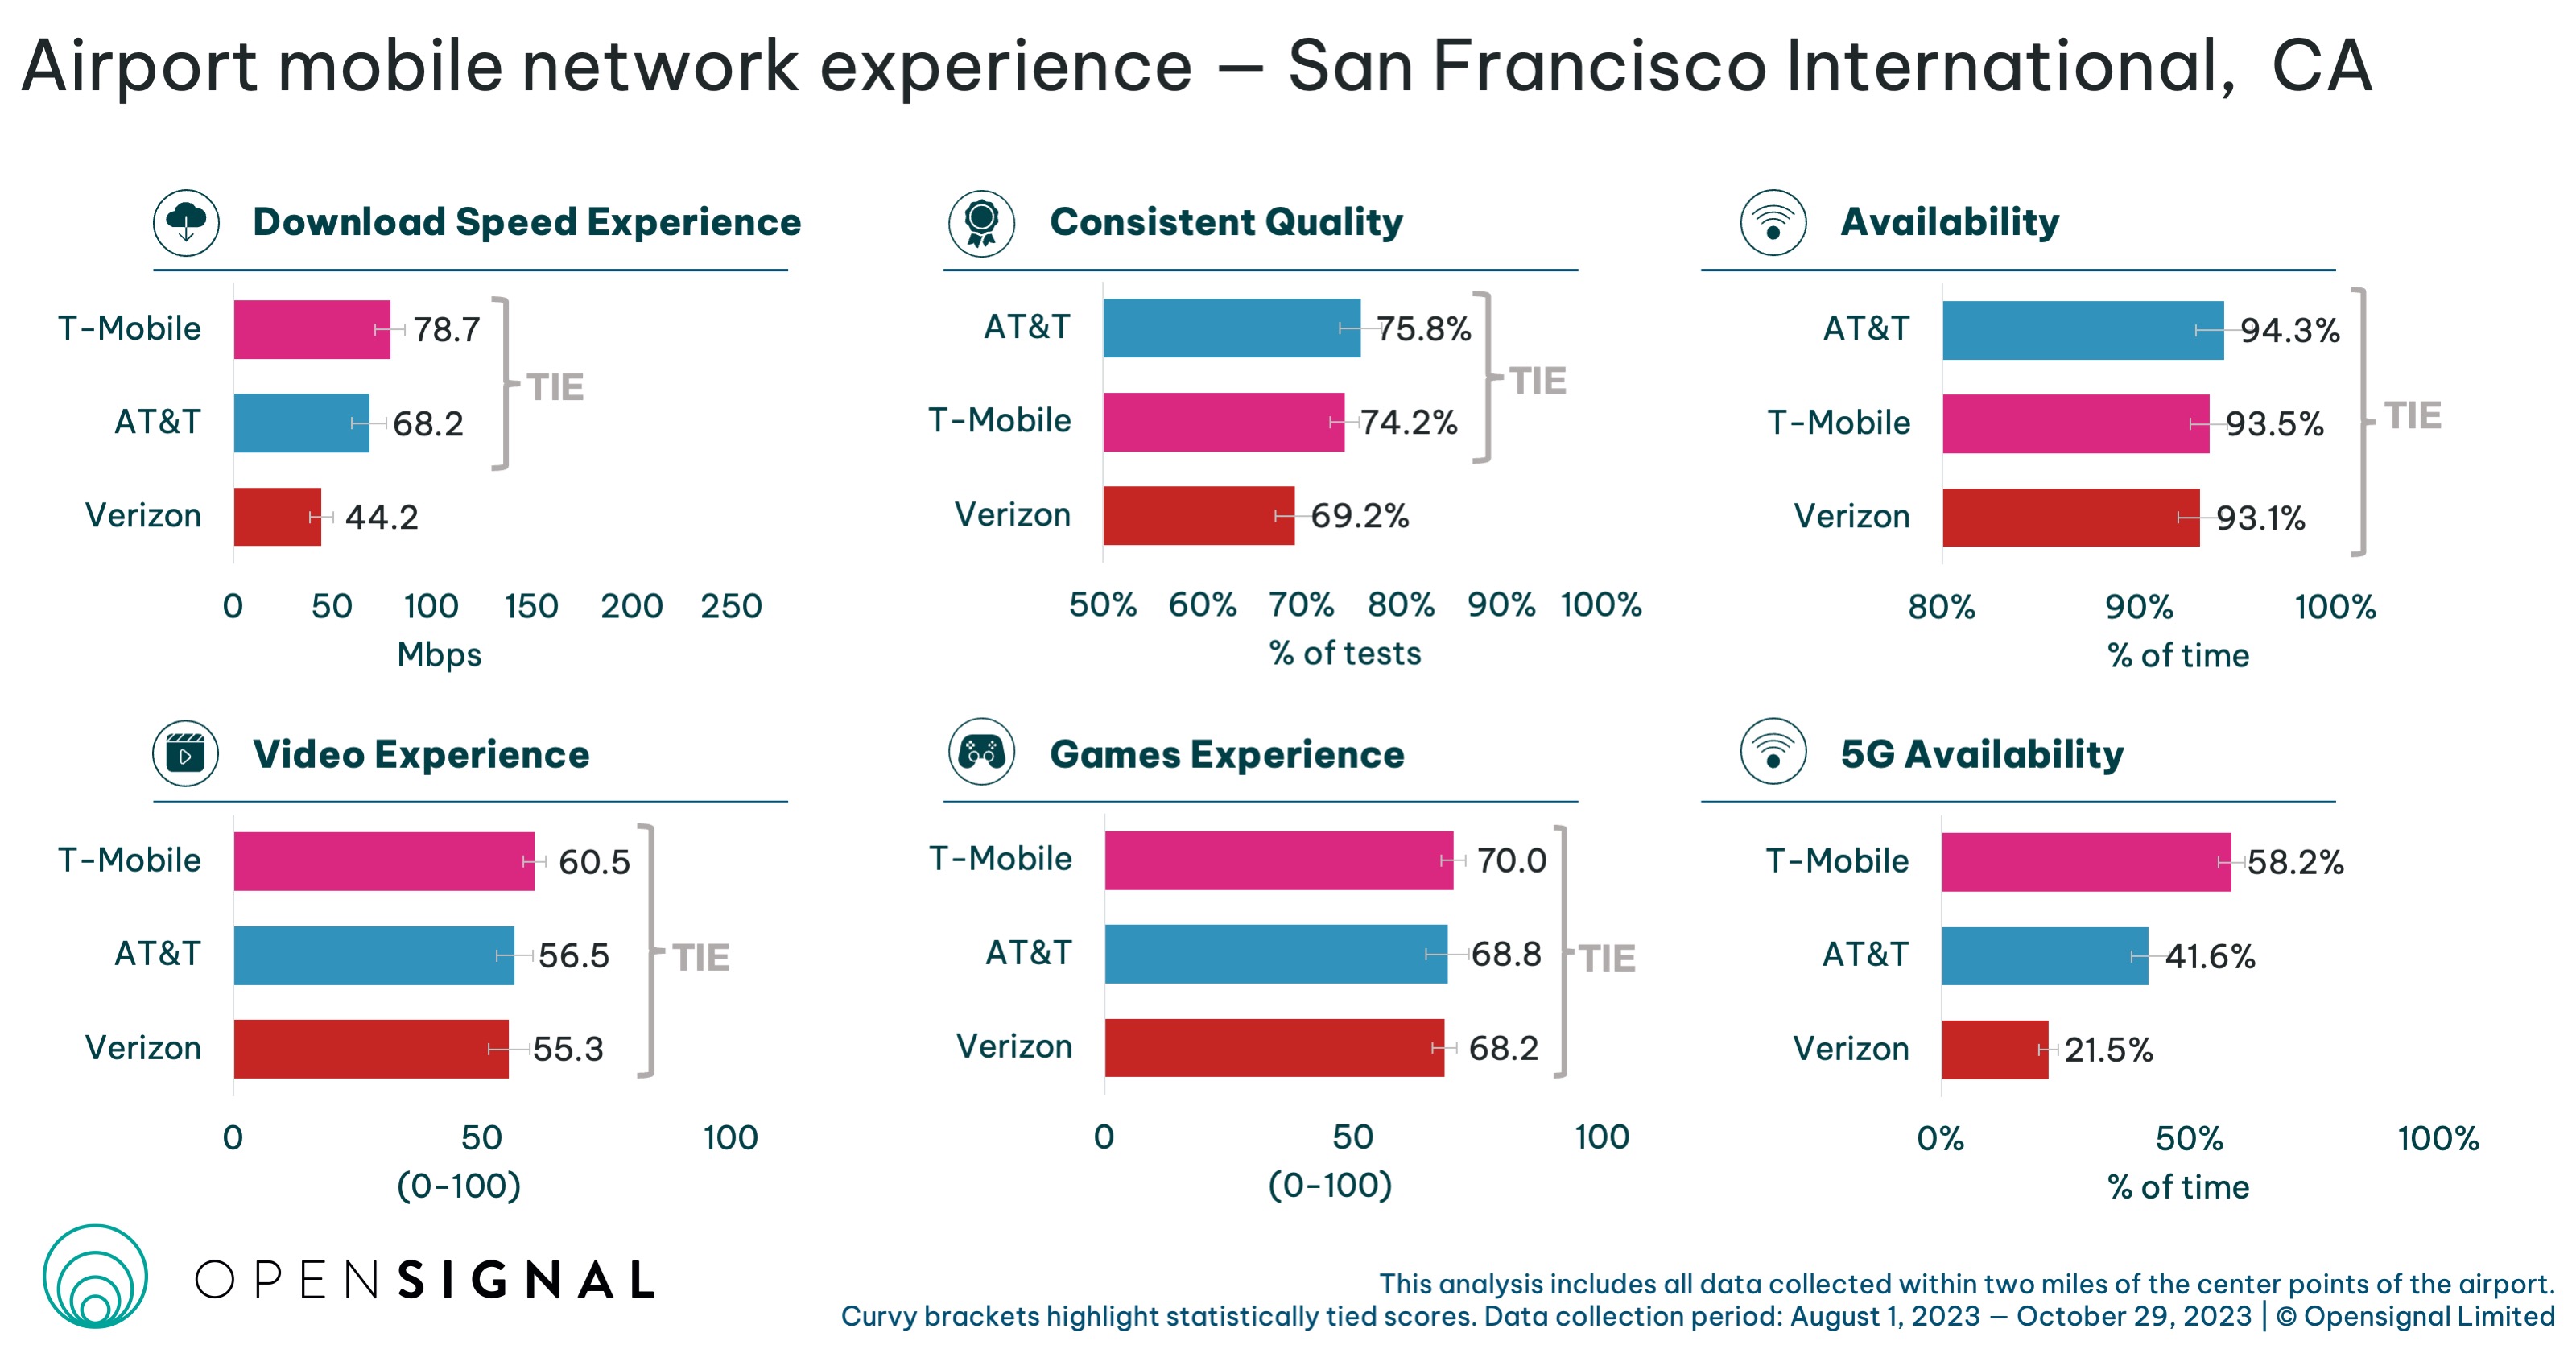
We observe only one outright highest score at San Francisco International, as T-Mobile leads for 5G Availability with a score of 58.2% — 16.6 percentage points ahead of second-placed AT&T, while Verizon comes third, with a score of 21.5%. AT&T and T-Mobile are the joint highest scorers for Download Speed Experience — with scores of 68.2-78.7Mbps — and for Consistent Quality, with scores of 74.2-75.8%. All three carriers are in statistical ties for Availability and Video Experience.

T-Mobile is the sole carrier in first place across three out of six metrics at Seattle-Tacoma International. It takes Download Speed Experience with a score of 90.2Mbps — 60.2% faster than Verizon and 2.2 times faster than AT&T. Our T-Mobile users enjoy the most consistent quality of mobile services around the airport, as the carrier comes first for Consistent Quality with a score of 75.5%.
T-Mobile has the highest score for 5G Availability — 63.6%. It commands an enormous lead over its competitors, as our 5G users on this network spend 4.6 times more time connected to 5G services than those on Verizon’s network — and 6.6 times more than their AT&T counterparts. Verizon secures the top spot for Games Experience, with a score of 71 points on a 100-point scale — while AT&T and T-Mobile jointly take second place, with identical scores of 64.3 points.
Opensignal Limited retains ownership of this insight including all intellectual property rights, data, content, graphs & analysis. Reports and insights produced by Opensignal Limited may not be quoted, reproduced, distributed, published for any commercial purpose (including use in advertisements or other promotional content) without prior written consent. Journalists are encouraged to quote information included in Opensignal reports and insights provided they include clear source attribution. For more information, contact [email protected].