Coverage is one of the most important measures of the mobile experience as users need to be able to connect to mobile services in the places they visit. Opensignal’s new Coverage Experience metric measures the geographic coverage of populated areas on a 10-point scale to represent the experience users receive as they travel around areas where they would reasonably expect to find coverage. Measures of coverage should reflect the real-world experience Historically, there have been a number of different ways to estimate mobile coverage:
Opensignal’s Coverage Experience measures — not estimates — the geographic coverage of populated areas and therefore more accurately reflects the coverage expectations and experience of typical users. This differs from the existing Opensignal Availability metric which focuses on connection time. Availability measures the proportion of time users spent with a type of signal — for example 3G, 4G or 5G. The new Coverage Experience metric completes the picture of how expansive a market’s coverage is, along with the coverage experienced by our users on each national operator within the market. 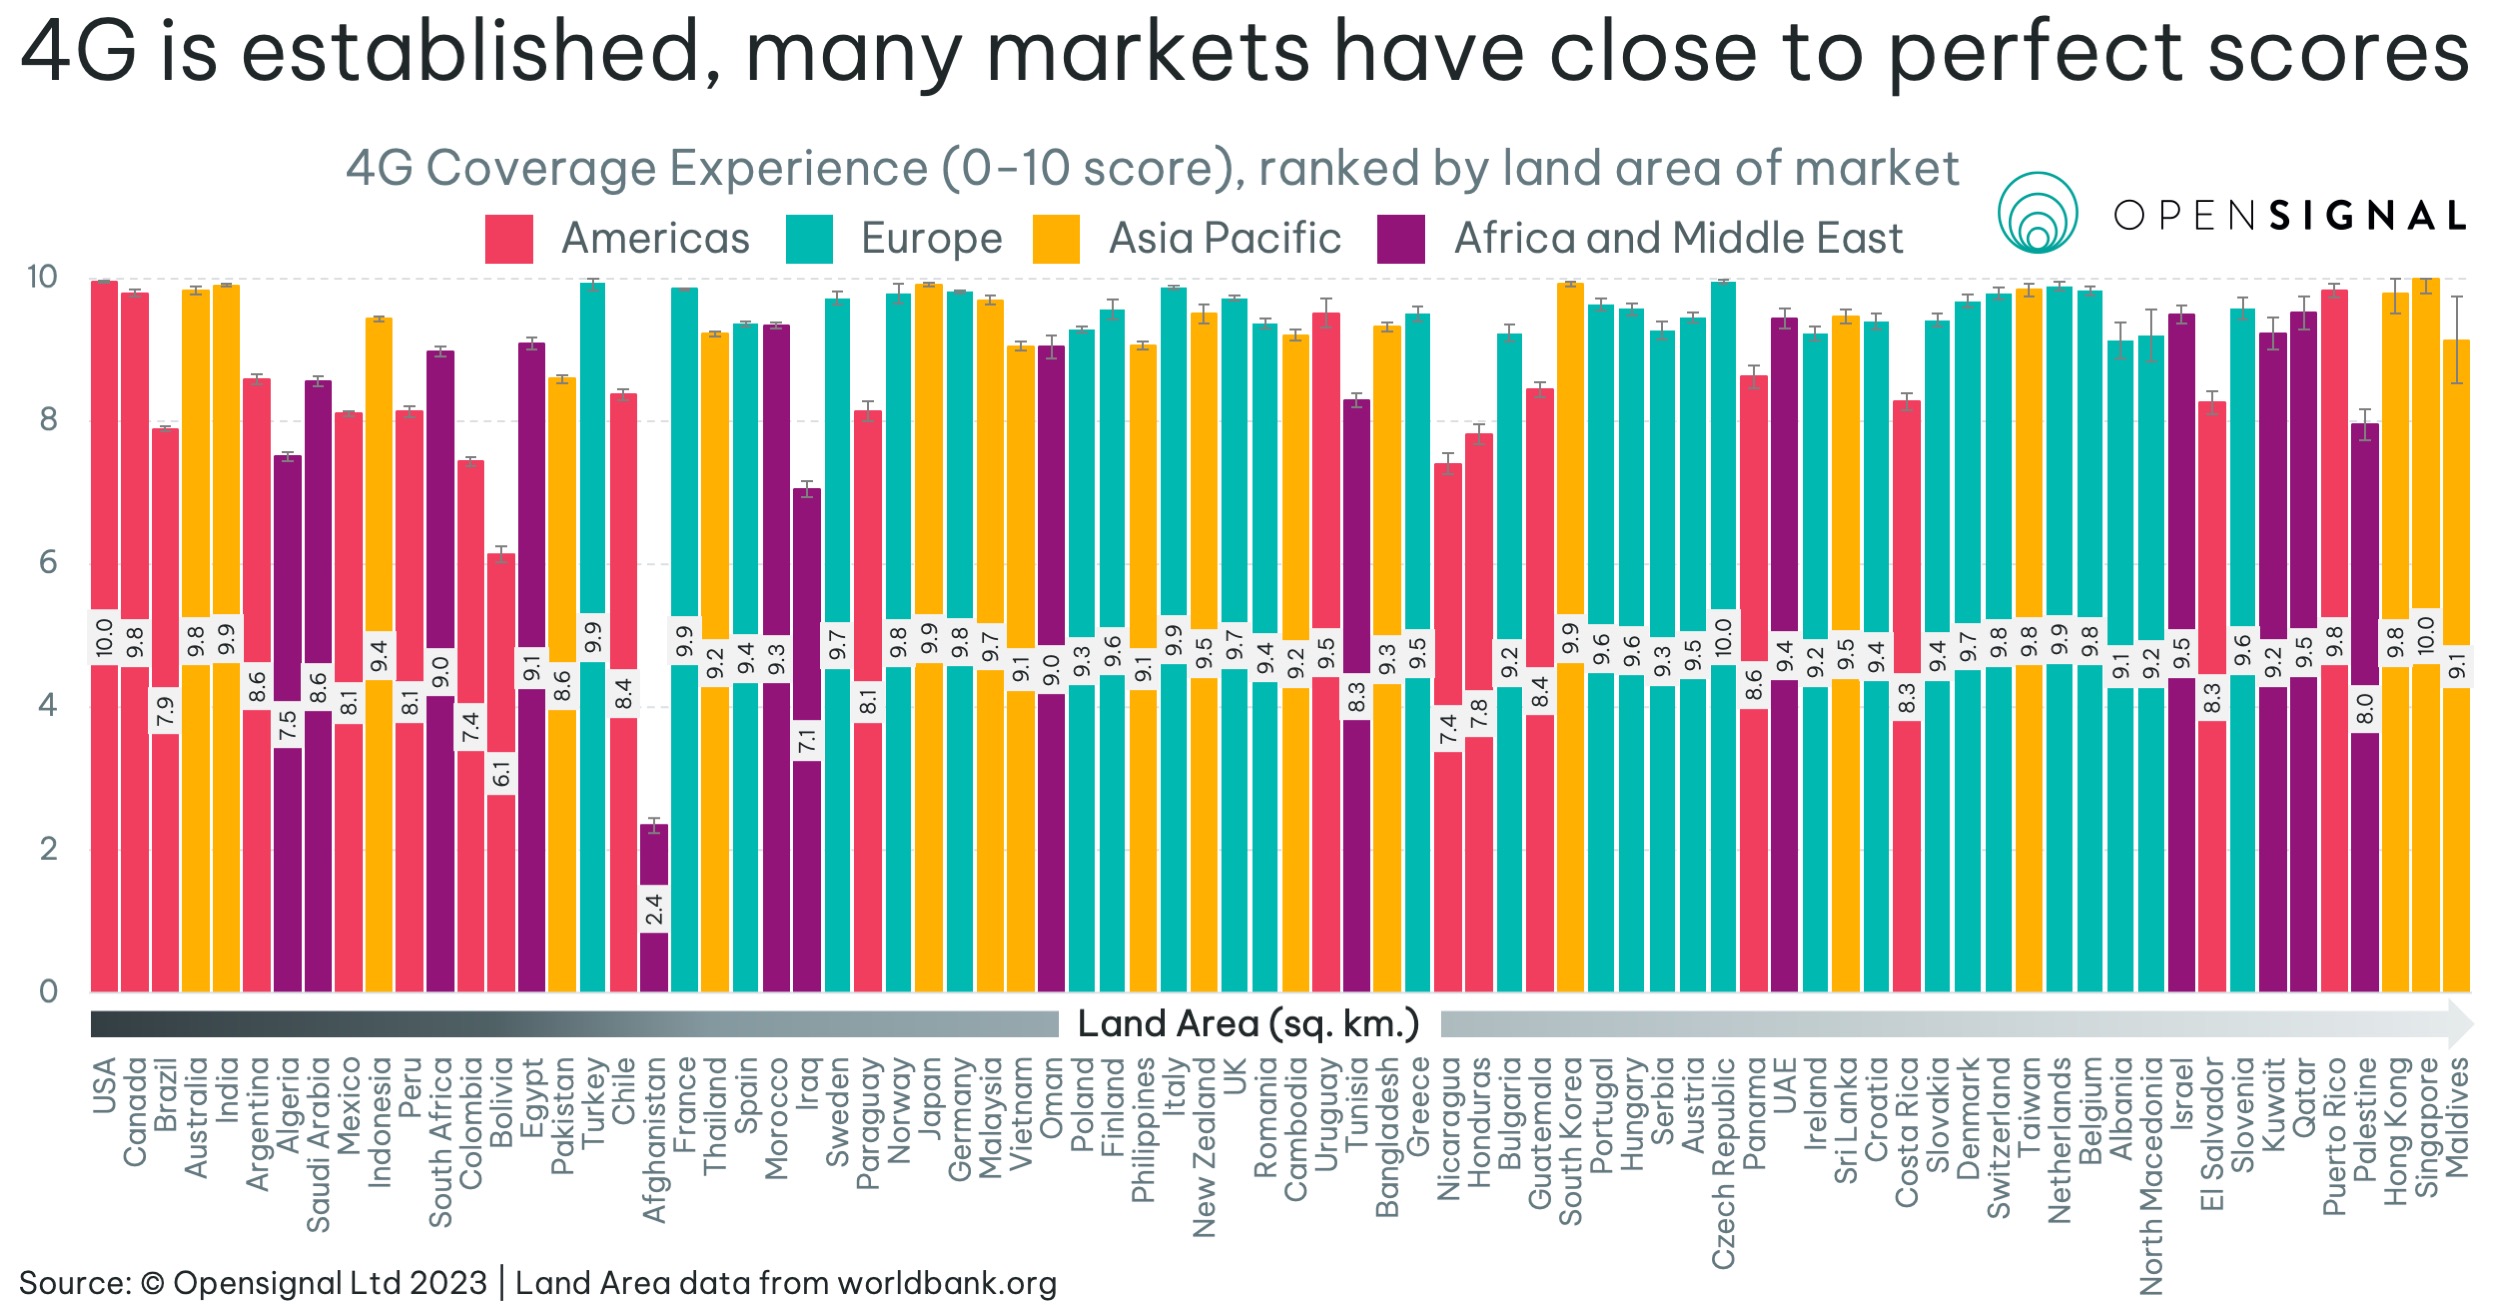 4G is a mature technology in most markets, with operators having had plenty of time to reach even the most rural users with their 4G network infrastructure. Even the largest markets such as the USA, Canada and Australia achieve near perfect scores — meaning that users manage to connect to 4G in almost all populated locations. In addition to the maturity of the technology, smaller markets by land area are easier for operators to serve and usually have less rural areas, therefore tending to see greater 4G coverage.
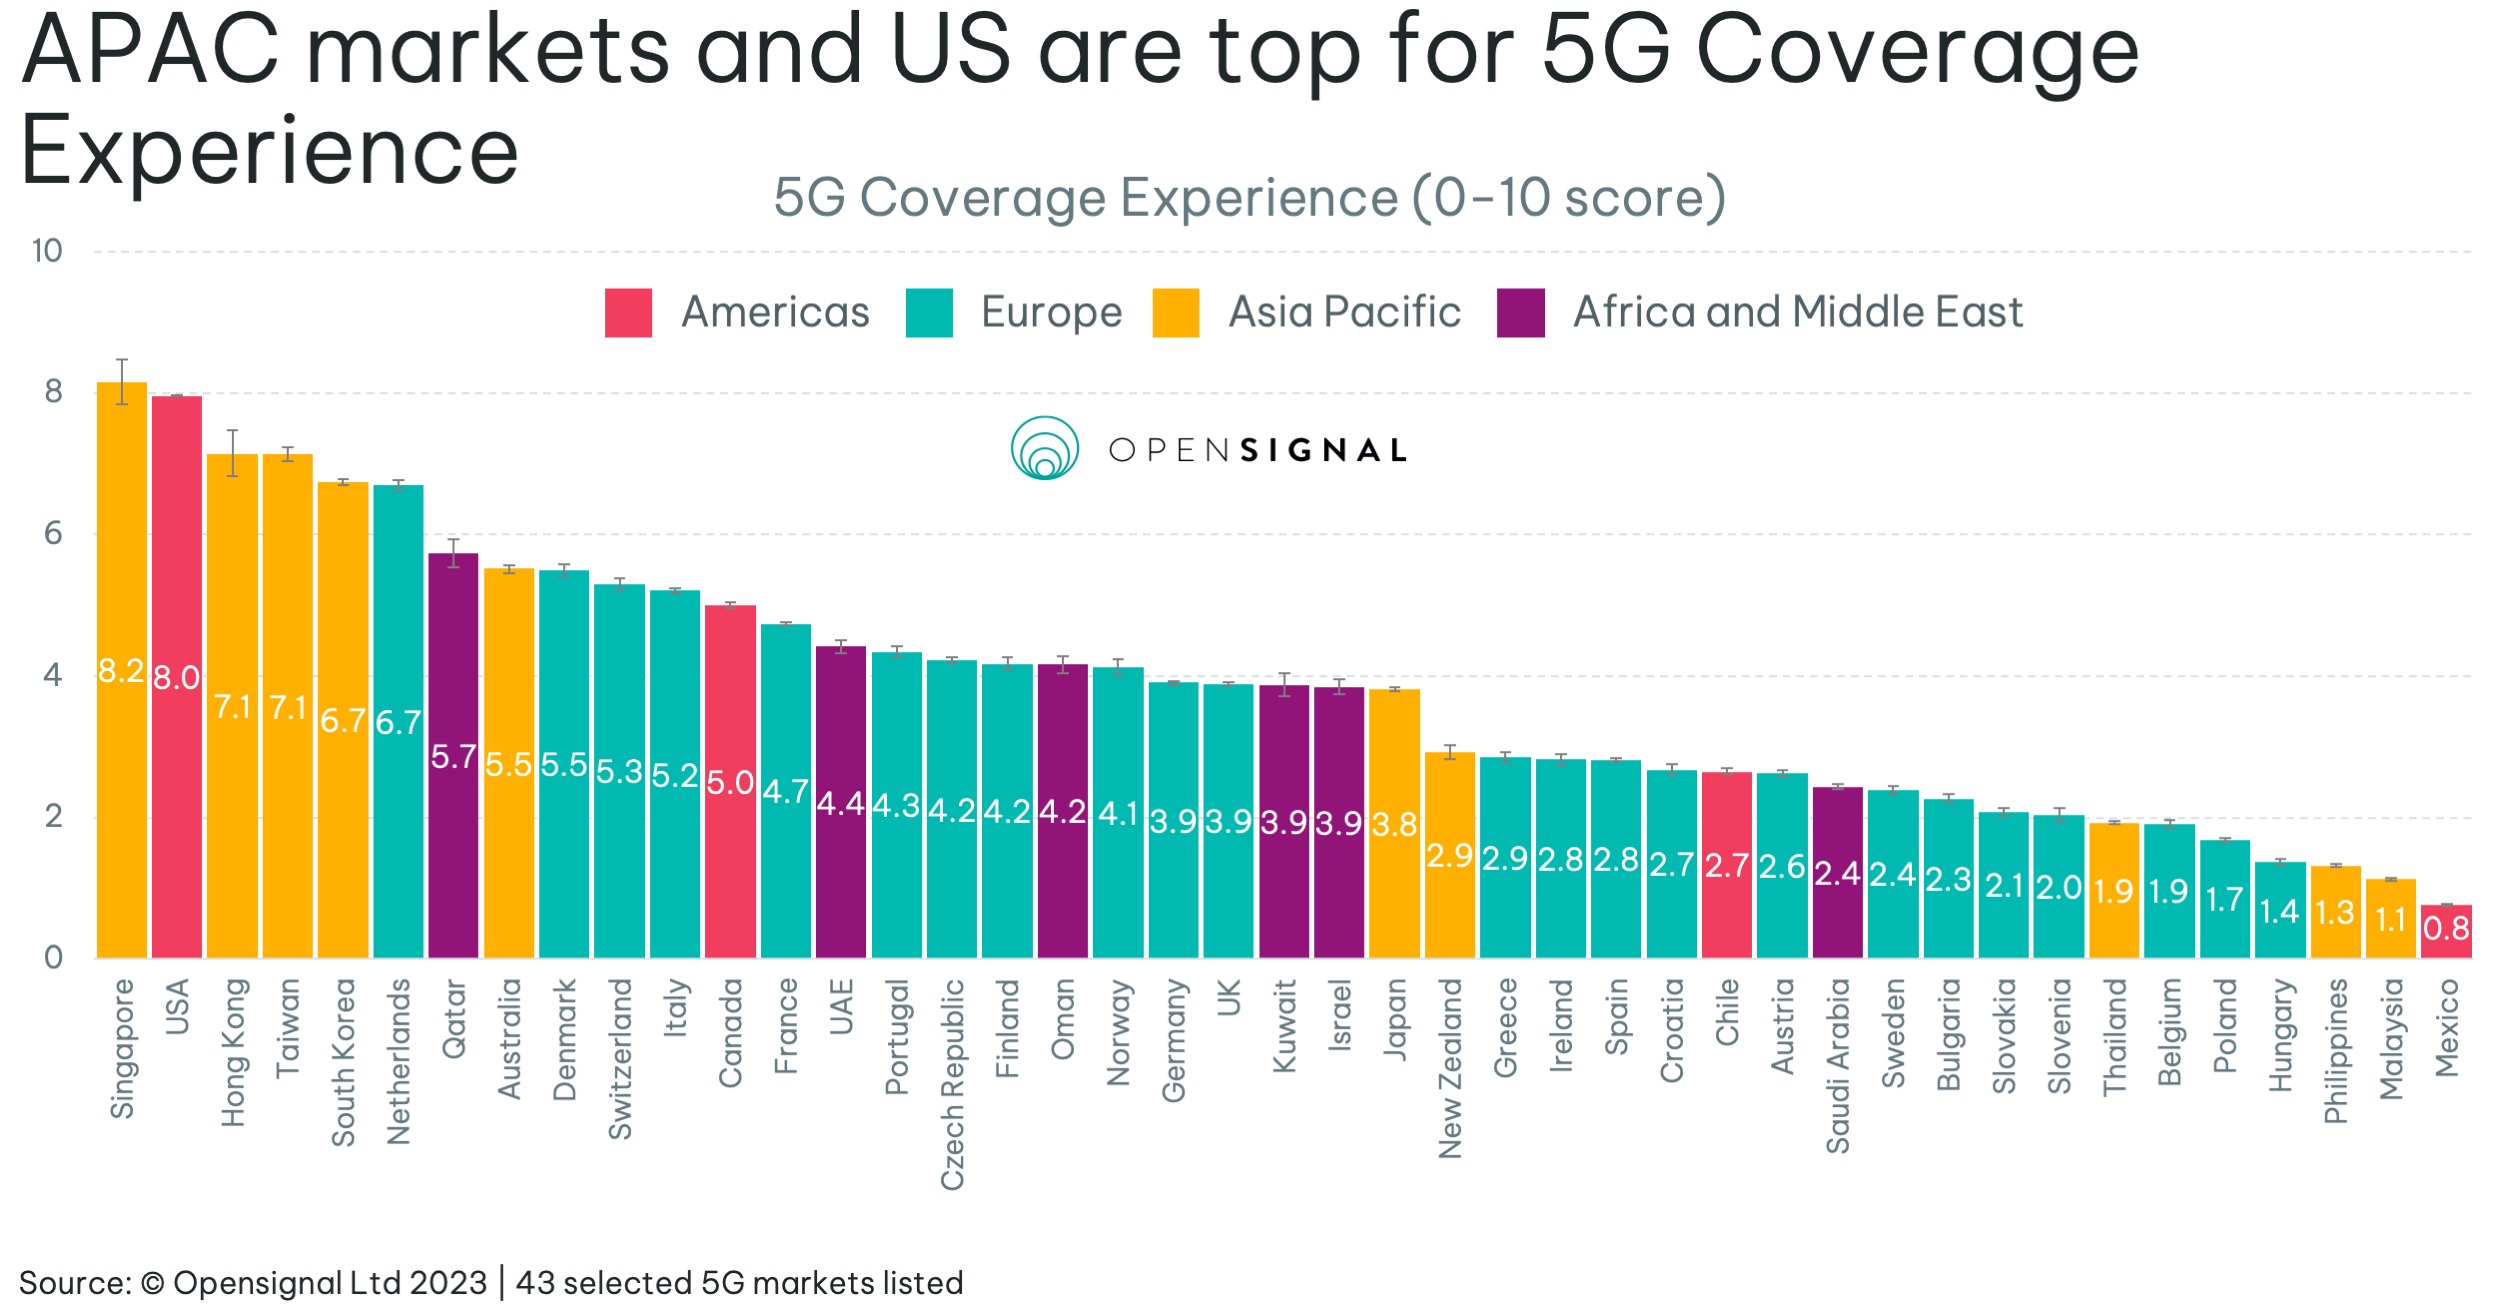
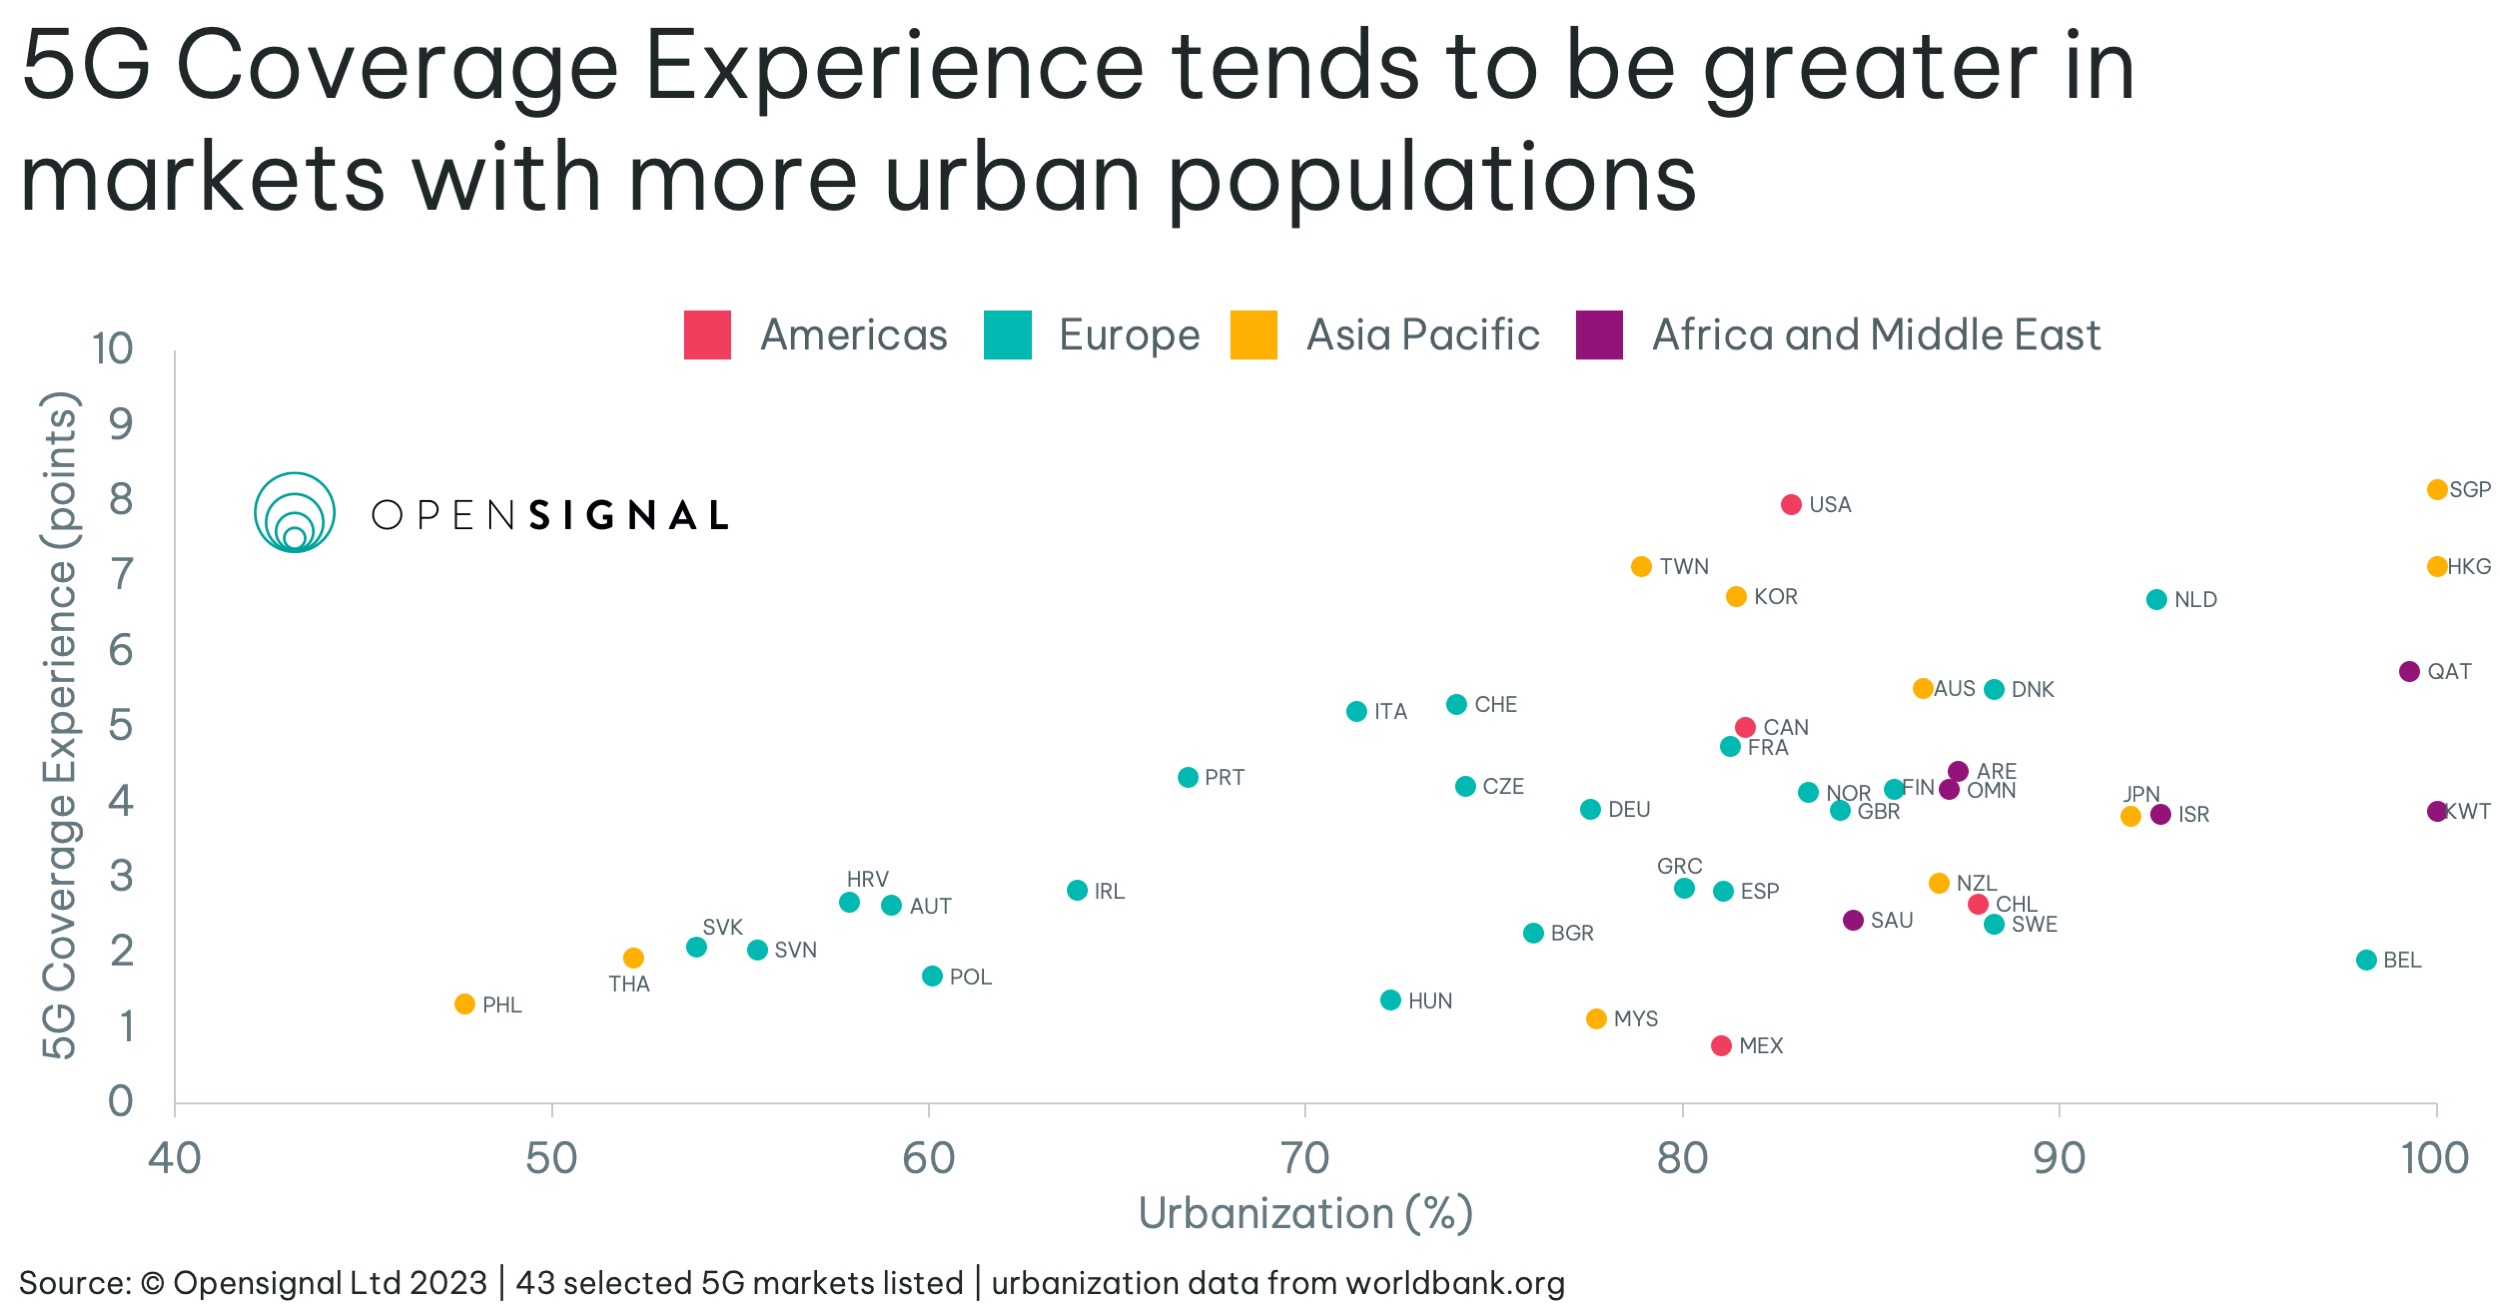
5G is the newest generation of mobile technology and offers staggering improvements in mobile experience over the previous generations. However, if users are unable to find an active 5G connection, they will be unable to use all the benefits that 5G brings. Although 5G became commercially available at different times across markets, even the earliest adopters – the USA and South Korea – have had 5G for just over four years. In all markets 5G has had far less time to become established than 4G and the 5G Coverage Experience scores reflect this lower maturity. South Korea and the USA score relatively high for 5G Coverage Experience — with the USA statistically tying for the top spot with Singapore. This is due to, in part, more widespread deployments of 5G in the USA on low frequency bands, enabling greater geographic reach compared to many other markets with large land areas. A higher percentage of urbanization in a market means that — all else being equal — operators are able to serve proportionally more users with the same number of base stations, which reflects in higher 5G Coverage Experience across such markets. The graph above shows that the score increases along with urbanization percentage, with markets below 65% struggling to score above three points. Some markets such as Singapore and Hong Kong have nearly 100% of their population living in urban areas. This greatly benefits them when it comes to rolling out infrastructure for 5G. Singapore launched 5G two years after the USA and South Korea, yet it ranks joint first for 5G Coverage Experience.
The level of population urbanization isn’t the only thing that can affect coverage. Launching 5G is a costly endeavor — spectrum auctions and the expensive infrastructure required mean that 5G’s expansion is also related to a market’s economic strength. Gross National Income (GNI) per capita is the total income of a nation’s people and businesses, divided by its population. It is an indicator of a market’s economic situation. The graph of 5G Coverage Experience against the GNI per capita for each market shows positive correlation — with wealthier markets featuring higher 5G coverage on average. At this stage in the 5G cycle 5G network equipment is still relatively new and expensive, and the higher the average income of a market’s citizens, the more revenue operators will tend to generate, and the more they can afford to spend on mobile connectivity. This influences the amount that operators are willing or able to invest in rolling out 5G networks. Why it matters Coverage is an important metric as it quantifies the extent to which users will be able to use their network in their home market. Opensignal’s new Coverage Experience metric represents the real-world experience users receive as they travel around areas where they would reasonably expect to find coverage. Below we have provided charts comparing the Coverage Experience results by operator for each market: Overall Coverage Experience View and download operator results for Overall Coverage Experience
5G Coverage Experience View and download operator results for 5G Coverage Experience |

Opensignal Limited retains ownership of this insight including all intellectual property rights, data, content, graphs & analysis. Reports and insights produced by Opensignal Limited may not be quoted, reproduced, distributed, published for any commercial purpose (including use in advertisements or other promotional content) without prior written consent. Journalists are encouraged to quote information included in Opensignal reports and insights provided they include clear source attribution. For more information, contact [email protected].