Opensignal data isn't just for the Tier 1 operators 

See who you're winning, who you're losing, and why


Mid-market broadband operators use Opensignal to find subscribers, protect their turf, and win new markets without a tier-one budget. 

If you've ever assumed Opensignal was only for the big carriers, you're not alone. The reality: the platform is specifically built for how regional operators work, self-serve where it counts, supported when it matters, priced for your market. 

Opensignal Subscriber Analytics

Subscribers move fast.  New promotions hit the market, network events happen, and subscribers churn. Most commercial teams find out what happened after the time to act has already come and gone. 

Broadband has never been more competitive. Fixed wireless and Starlink are moving into local markets without announcing it, and by the time most operators see it in their churn numbers, it's been happening for months. Meanwhile, the pressure to grow and retain subscribers keeps building, and budgets aren't growing to match.

Opensignal Subscriber Analytics gives your commercial and marketing teams the visibility to act before the damage is done. The data comes from continuous, passive observations across millions of real devices, which means every reading reflects what subscribers actually did: not a survey, not a model, not an assumption. You see which local markets are growing or contracting, which competitors are gaining ground, where your subscribers are going when they leave, and where your wins are coming from.

That visibility operates at the city level, precise enough to aim your retention spend at the neighborhoods that need it, identify new markets worth entering, and stop blanketing your entire footprint with spend that only a fraction of it needs. Every week, your team knows exactly which local markets are at risk and which competitors are targeting your base, so you're making decisions on data, not gut feel.


Complete market visibility

flow-share

Flow Share

Track where your subscribers are going, and where your competitors' are coming from

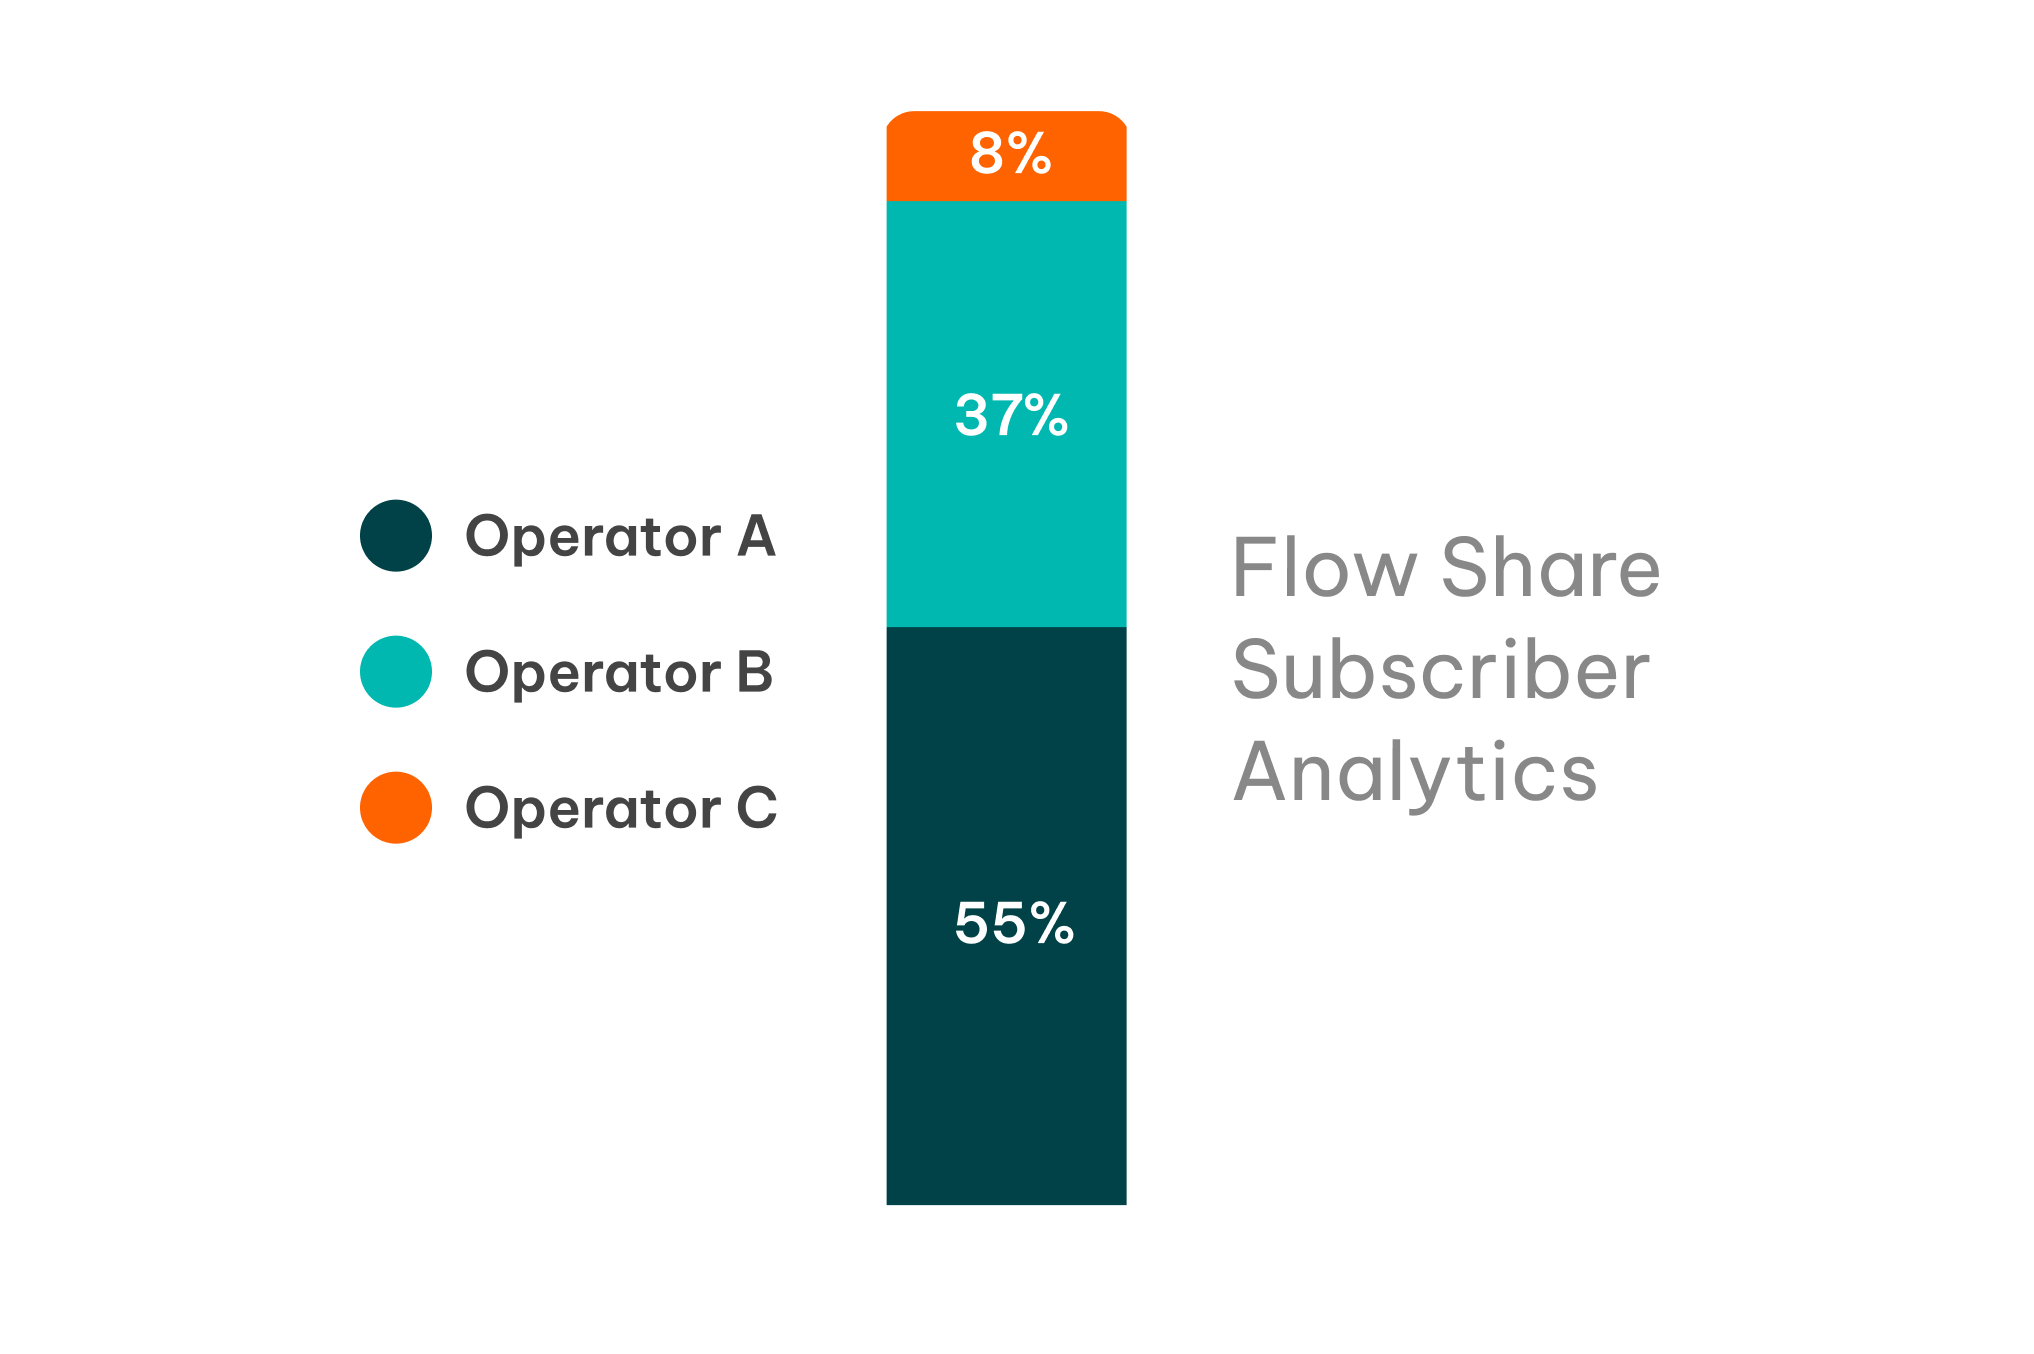
Flow Share tracks the actual switching behavior of subscribers across all operators in your market. Each week you see how many subscribers you won from each competitor, how many you lost and to whom, and what your net flow ratio looks like at local market level.

This is the data that tells you which campaigns are working, which promotions are pulling subscribers away from you, and which competitor is most exposed to a conquest play right now.

Key features:

  • See win share and loss share against each competitor, broken down by region and brand pair
  • Track wins-per-loss ratio weekly to monitor whether your net flow position is improving or declining
  • Use win composition data to see which brands your acquisitions are coming from
  • Use loss composition data to build targeted win-back campaigns against specific brands in specific local markets
  • Trendlines surface the impact of promotions, outages, and network events within days


Market Share

See your competitive position across every local market

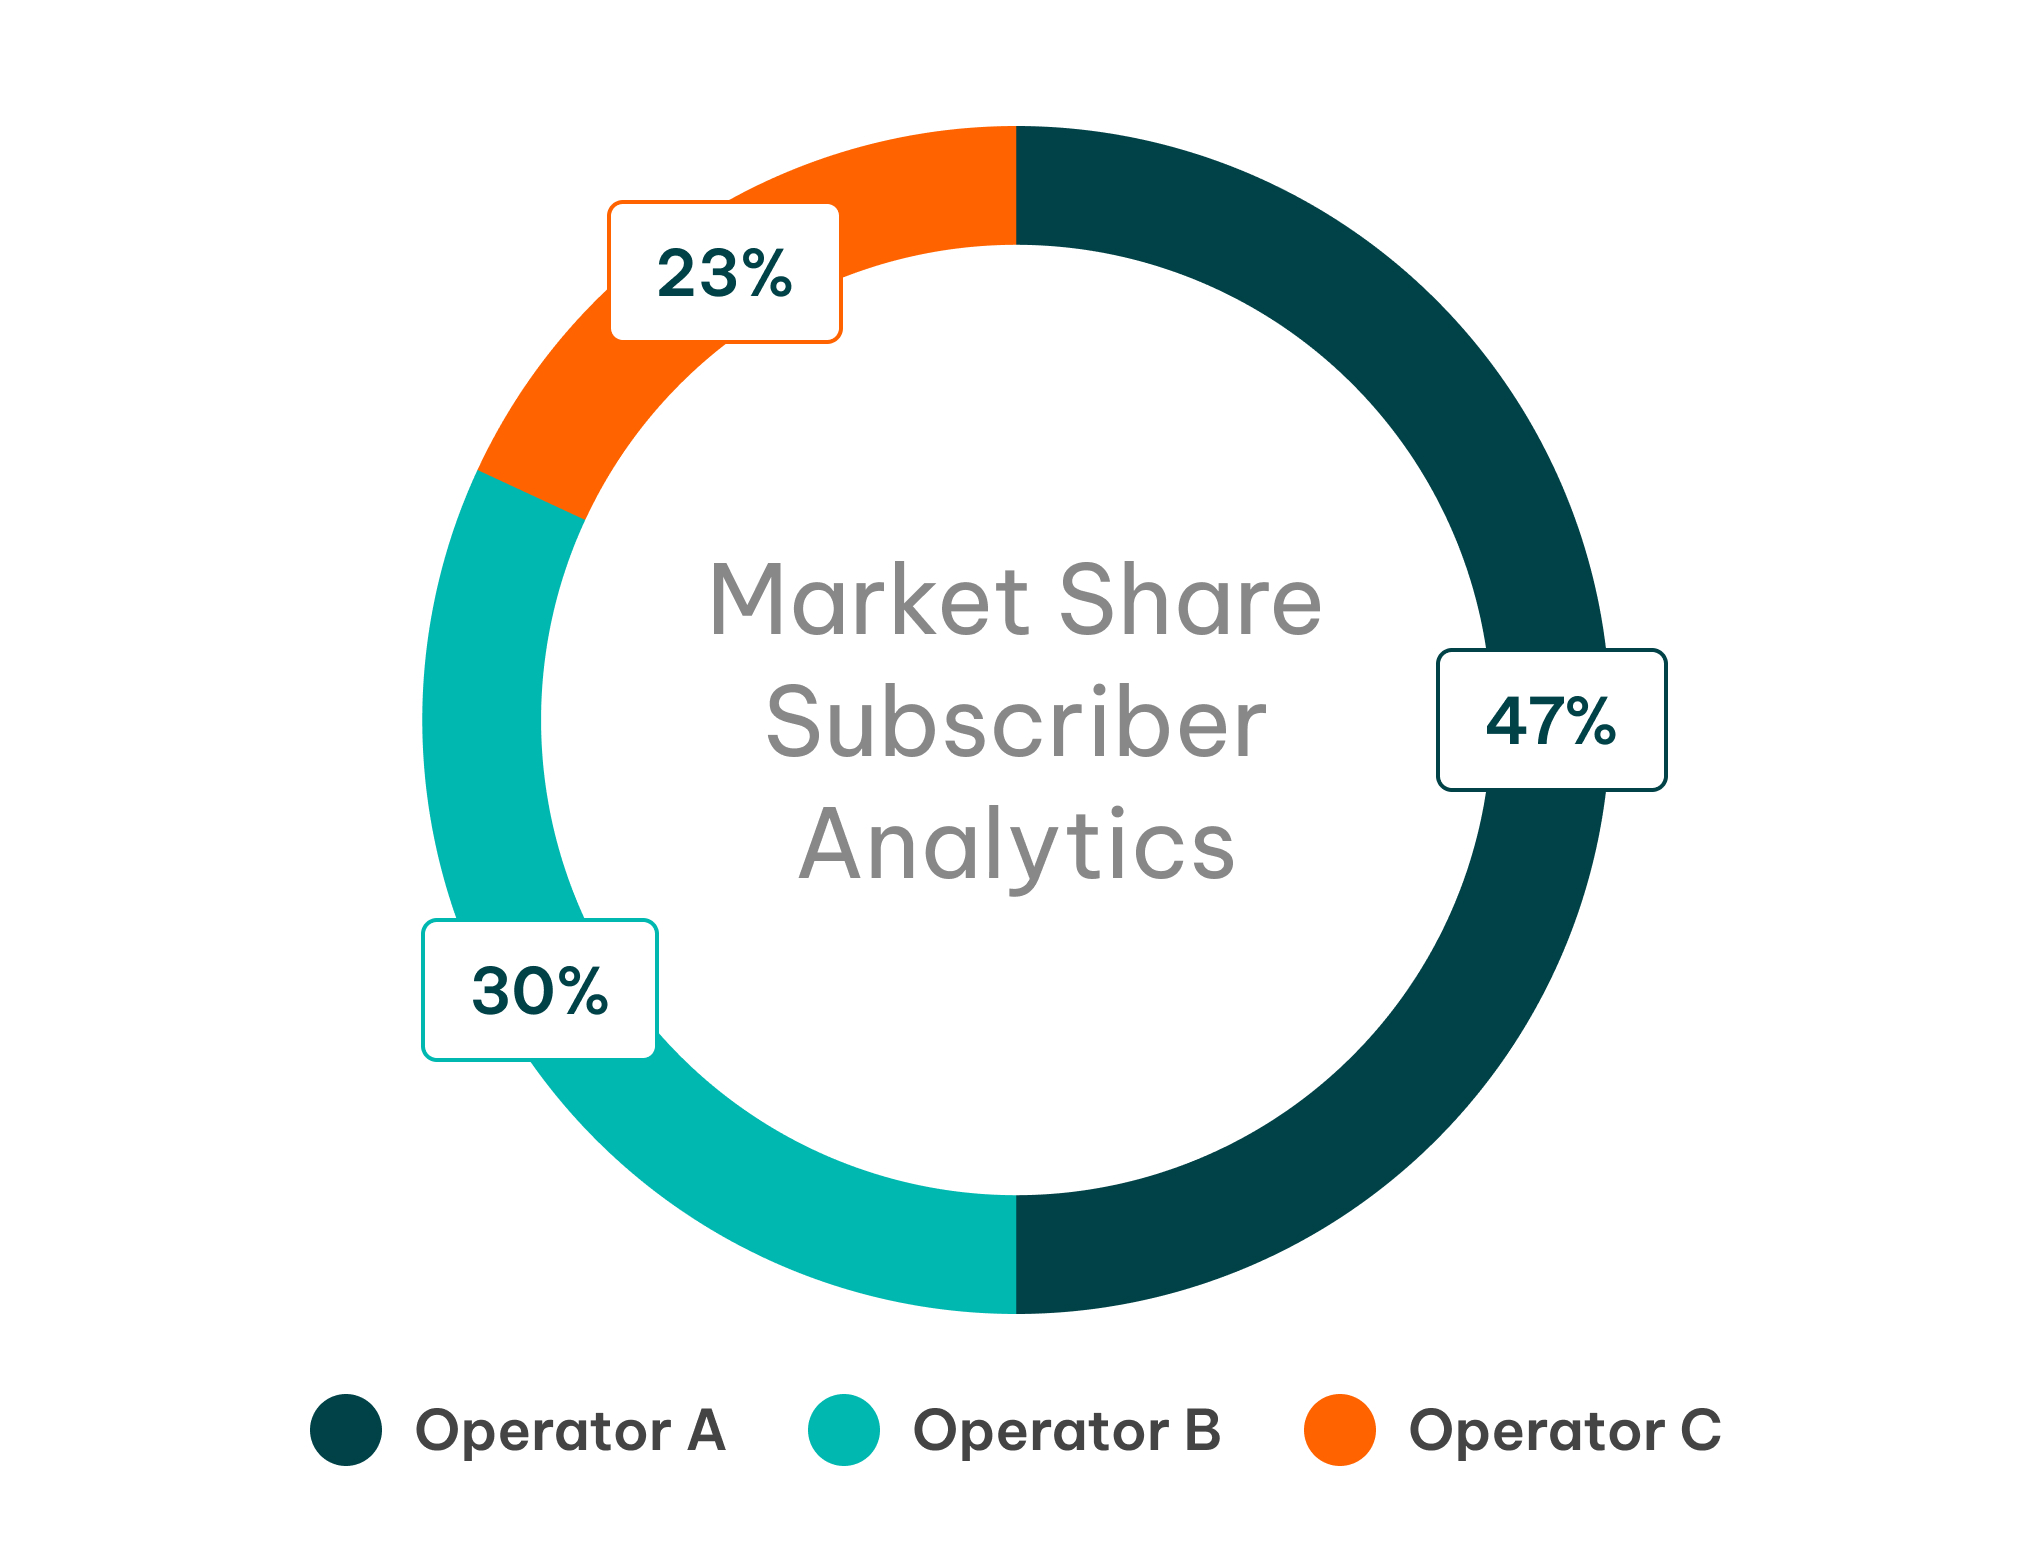
Market Share shows your subscriber base relative to every operator in your market, broken down by region, technology, sub-brand, and MVNO. You see which local markets are growing week over week, where competitors have been quietly gaining, and where your strongest positions are.

This information tells a commercial team where to defend, where to spend, and where there is room to grow.

Key features:

  • Track your share by carrier, brand, and MVNO across national, regional, and city-level geographies

  • Identify growth markets and rank competitors by share position

  • Monitor how many subscribers in each local market hold both mobile and broadband with the same operator 

  • See competitor presence at sub-regional granularity to inform local promotional targeting and retail expansion decisions

market-share
dots

Operators who have put our Frontline Network Experience solutions to work see results quickly

Subscriber Growth
5-15%

SUBSCRIBER GROWTH

Perception Change
20-30%

POSITIVE PERCEPTION CHANGE

CTRS
1.5 - 2.5x

CTRs PERFORMING ABOVE BASELINE

Use our independent data to validate your marketing claims

Brand Licensing and Frontline Network Experience converts shoppers into subscribers.

Opensignal provides public reporting on mobile and broadband network experience in markets around the world. Learn more about how we can improve your external messaging with our independent insights.

Solve the reasons your team keeps falling behind


Churn

Your reports describe a market that already moved

When a competitor runs a promotion or improves their network quality, subscribers respond within days.

By the time that activity shows up in a churn report, your market share has already shifted.

Commercial teams spend most of their time diagnosing last quarter's losses instead of preventing this quarter's

Fragmented tools

Fragmented tools tell you one thing and miss everything else

CRM data tells you who left. NPS tells you how they felt when they left. Network KPIs measure speed and coverage. Point-of-sale records show what subscribers bought, not who they switched to.

Each source is right about one thing. None of them show the competitive switching dynamics that explain what is actually happening across your market.

late insights

Your existing data is one step behind

Standard panel research delivers monthly or quarterly reads. Subscriber behavior moves daily.

Commercial teams allocating acquisition and retention spend from 90-day-old data are working from a picture of a market that’s already shifted.

Why operators are choosing Subscriber Analytics

Subscriber Analytics gives mobile and broadband commercial teams a continuous view of market share, subscriber switching, and competitor pricing. Built from real device observations at scale, it covers win share, loss share, and churn signals across your full network footprint. 

Action vs. Intent

360° Degree Views

Near Real-Time Reporting

Ground Truth vs. Panel Bias

When your team needs to act locally with confidence, Subscriber Analytics is the only tool that closes the gap from data to decision.

Ready to get started? Let's talk

Sign up to our newsletter to receive the latest Opensignal reports in your inbox