5G is evolving fast in the U.S. In just a few months, the 5G experience we saw has changed dramatically on each carrier. And, while progress has boosted many 5G measures, in other 5G categories we see big drops.
For example, in a recent insight looking at 5G over the summer, we saw that average 5G Download Speed using Verizon ranged from 508.3 Mbps to 338 Mbps. But now in these five cities the highest average speed we see using Verizon is 68.0 Mbps. Similarly, T-Mobile users saw a real-world average 5G Download speed of 49.2 Mbps then, here we see speeds range of 83.8 Mbps, 74.9 Mbps, 65.8 Mbps, 59.8 Mbps in four of the cities. But at the same time, we see jumps on 5G Availability on both T-Mobile and Verizon.
Now, we see the 5G Download Speed across the three carriers is neck and neck in five major cities. The 5G market is now very competitive. In three cities, there is no clear leader in 5G Download Speed because the average 5G speeds are close enough that our confidence intervals overlap. These results are in marked contrast to our previous results.

Why has the experience changed so much in such a short space of time?
-
Verizon’s 5G nationwide is very different. On October 13, Verizon launched 5G services using dynamic spectrum sharing (DSS) on lower frequency bands, which are also used for 4G service. These bands have lower overall capacity, much lower typical speeds, and much better reach than the mmWave that Verizon previously used exclusively. Verizon now markets its existing, still extremely fast, mmWave-based 5G service as 5G Ultra Wideband alongside this new extension of 5G capability.
-
T-Mobile has been expanding mid-band 5G. While T-Mobile offers 5G using three types of spectrum — low frequency 600 MHz that has good reach, mmWave like Verizon, and 2.5 GHz mid-band spectrum — in the second half of 2020 it has been focused on expanding its 2.5 GHz 5G services. This offers fairly good reach and more capacity than the 600 MHz that previously made up the bulk of its services. Also, T-Mobile is using standalone access in some areas, aiming to boost the reach of its 5G services.
-
AT&T expanded 5G coverage. At the end of June, AT&T launched 5G in 28 markets, also using DSS technology.
-
The 5G iPhone has arrived. Now Apple has launched 5G, the large proportion of Americans that prefer iPhone — approximately half the market — are now adopting 5G in large numbers. While Verizon featured at Apple’s iPhone launch event, AT&T has long had a strong iPhone presence dating back to being the original iPhone carrier in the U.S.
Strikingly, despite the fall in Verizon users’ average 5G Download Speed from hundreds of Mbps to a fraction of that speed, the 5G experience continues to be much faster than 4G. On all three carriers, in each of the five cities we are examining, their users 5G Download Speed is considerably faster than their 4G Download Speed.
There is much cynicism about 5G in the U.S. at the moment, Opensignal’s data indicates this is misplaced. As U.S. carriers build on their initial 5G launches, the 5G experience will improve, especially as new 5G spectrum becomes available in the U.S. that allows carriers here to emulate the 5G experience in other countries where similar 5G spectrum has already been deployed.

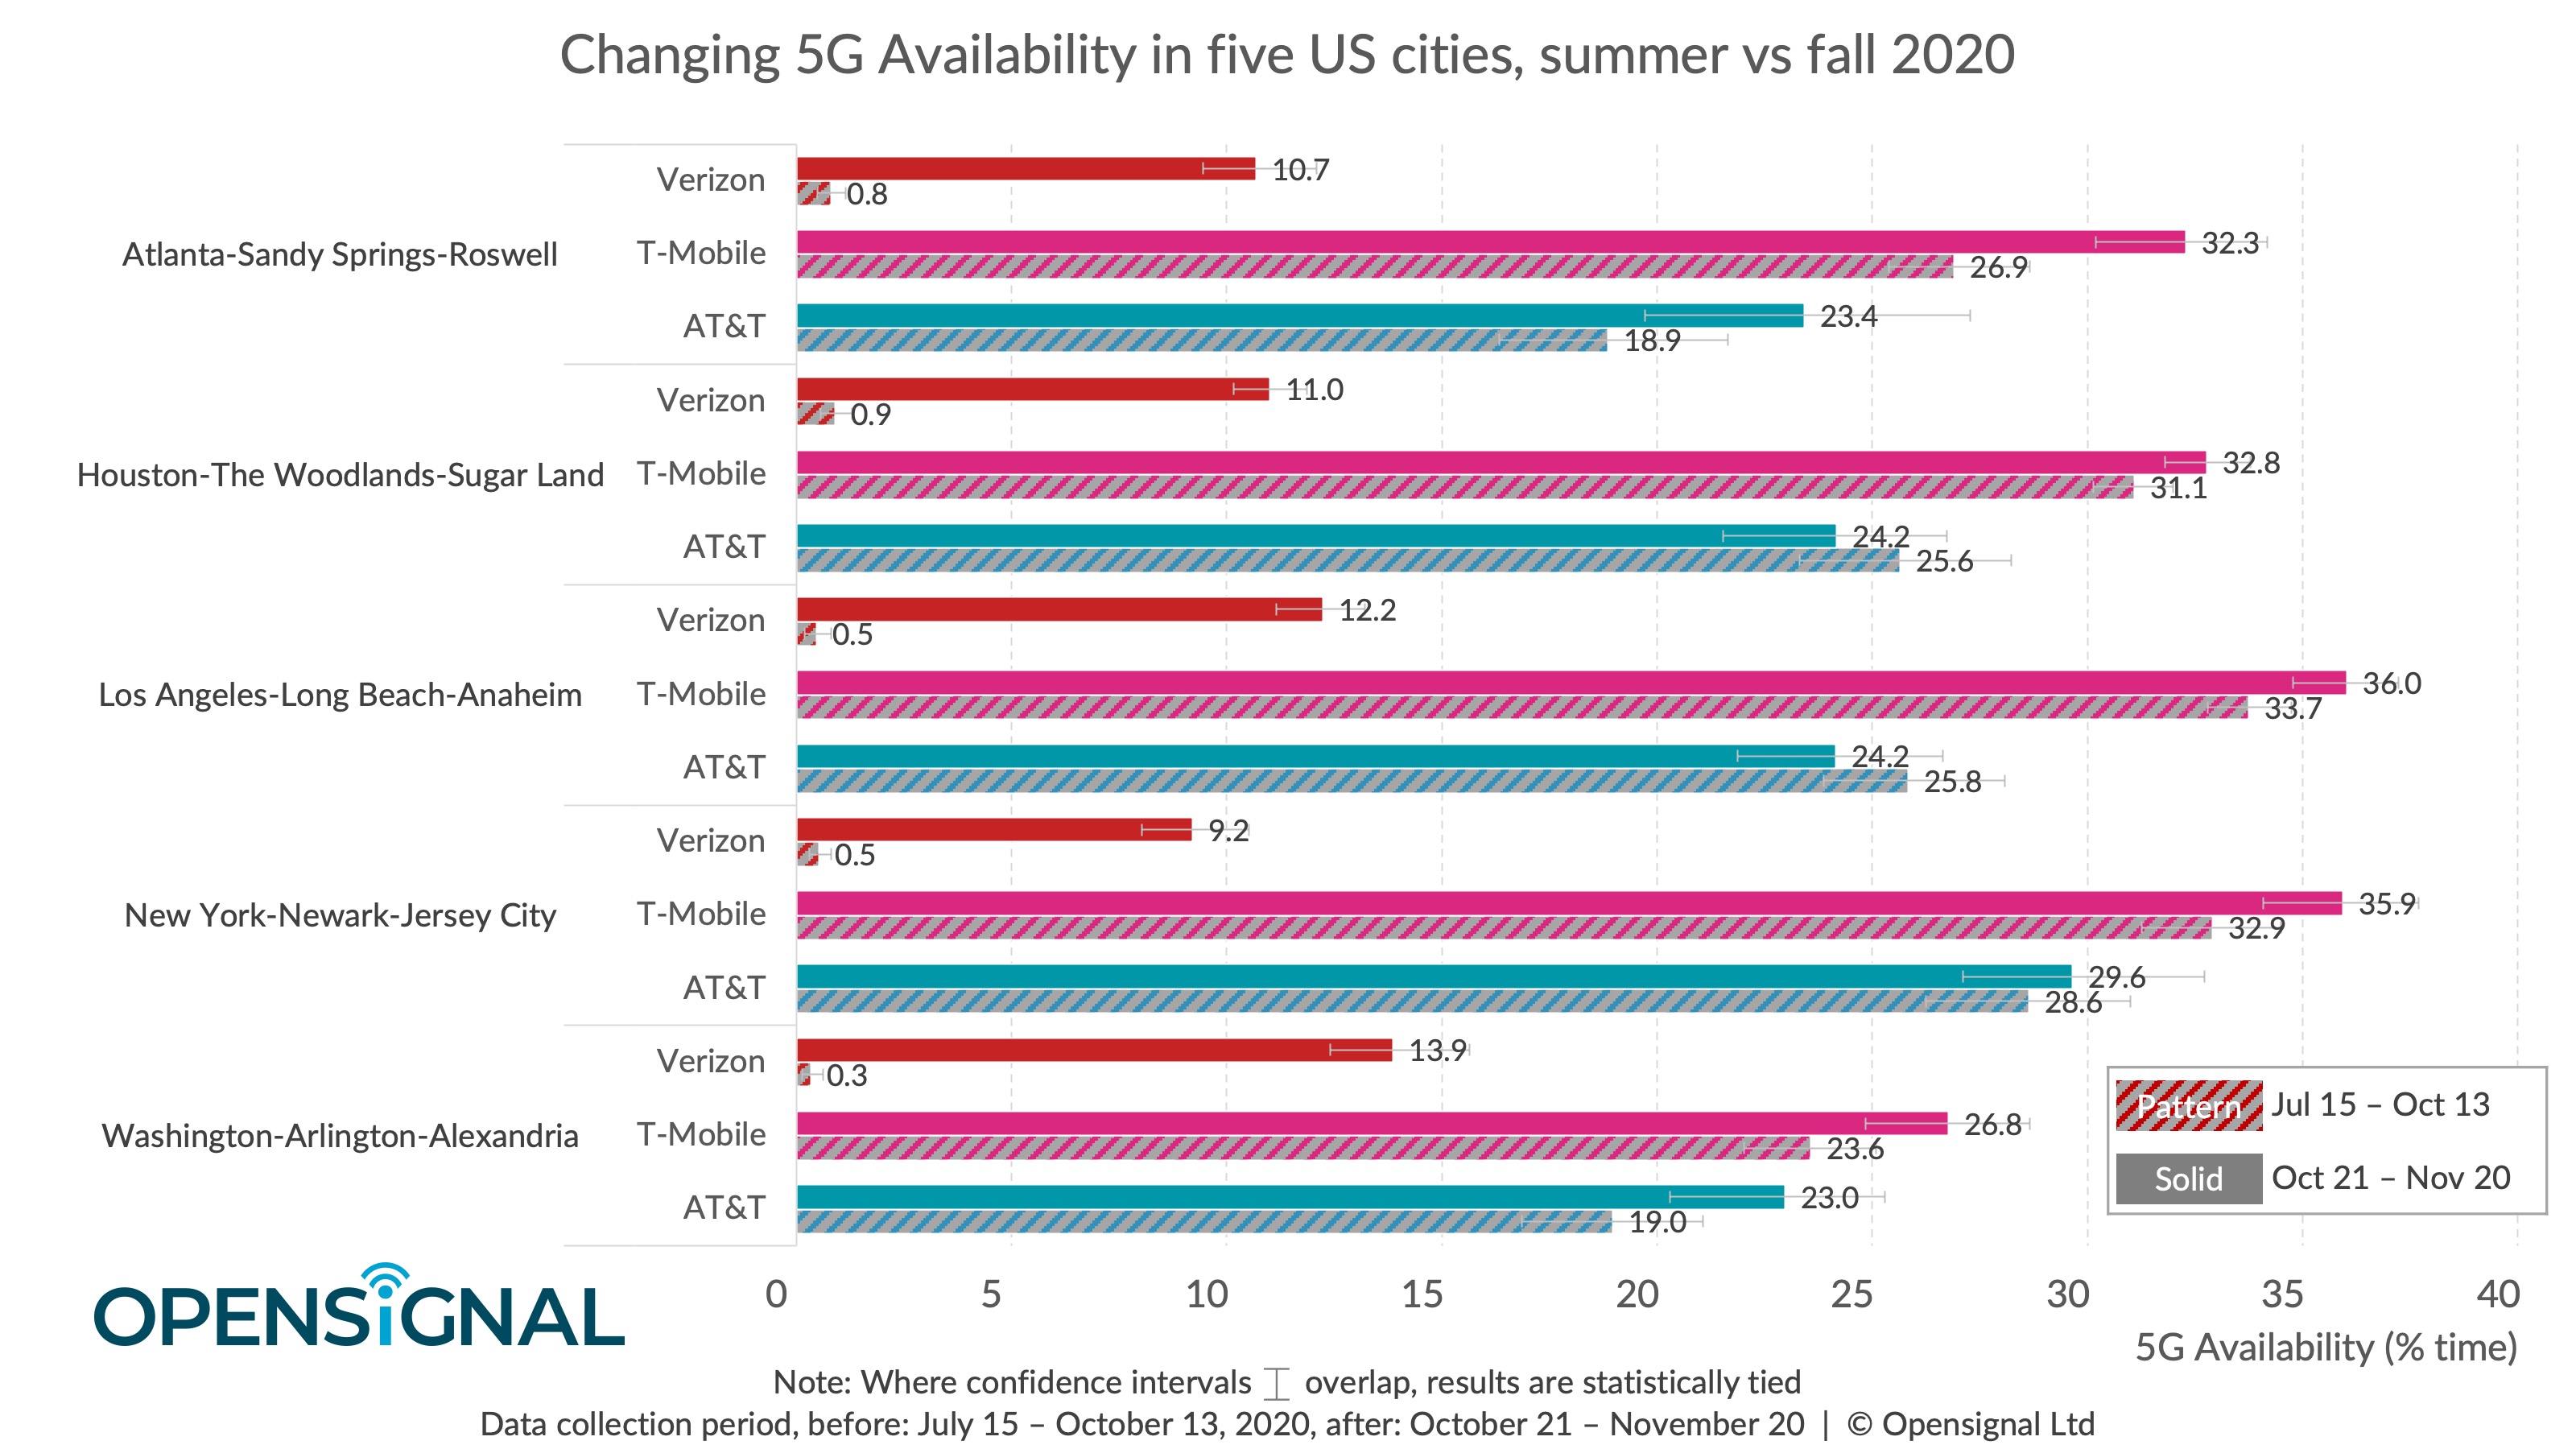
We also see a massive change in 5G Availability on two carriers. Back in our last national report, Verizon saw a 5G Availability score of 0.4%, meaning 5G users connected to 5G under one half a percent of time. Prior to the nationwide 5G launch on October 13, Verizon’s 5G Availability was under 1 percent in all five cities. After that date we see Verizon’s score is now ranging from 9.2% up to 13.9% across these five major cities. But Verizon still has much ground to make up on its competition.
T-Mobile users are also seeing increases in 5G Availability, and their availability is now over thirty percent in four of the cities and is only just below that mark in the fifth. However, we see little movement in 5G Availability using AT&T with small differences in the average score and overlapping confidence intervals indicating it’s too early to call these differences a meaningful change.

When we look at our last measure, Download Speed Experience – 5G Users, we also see a tight competition between the operators and a change between the summer and the most recent fall period. This measure considers the average 5G Download Speed of users with a 5G smartphone and a 5G tariff, as well as their average 4G speed and the amount of time spent connected to each technology. The resulting score indicates the typical overall experience of a 5G User.
In the fall, we see an apparent drop in average Download Speed Experience – 5G Users score for Verizon in all five cities. As confidence intervals narrow we will be able to call out how significant this change proves but there are clear warning signs for Verizon.
By contrast, we see T-Mobile’s score is on an upward trajectory in Washington, New York, Houston and Atlanta indicating how dynamic and fluid the U.S. 5G market remains. AT&T users see much less change here too. AT&T must not become complacent if it is to keep pace with the moving 5G experience bar in the U.S.
Opensignal Limited retains ownership of this insight including all intellectual property rights, data, content, graphs & analysis. Reports and insights produced by Opensignal Limited may not be quoted, reproduced, distributed, published for any commercial purpose (including use in advertisements or other promotional content) without prior written consent. Journalists are encouraged to quote information included in Opensignal reports and insights provided they include clear source attribution. For more information, contact [email protected].